Fig. 3
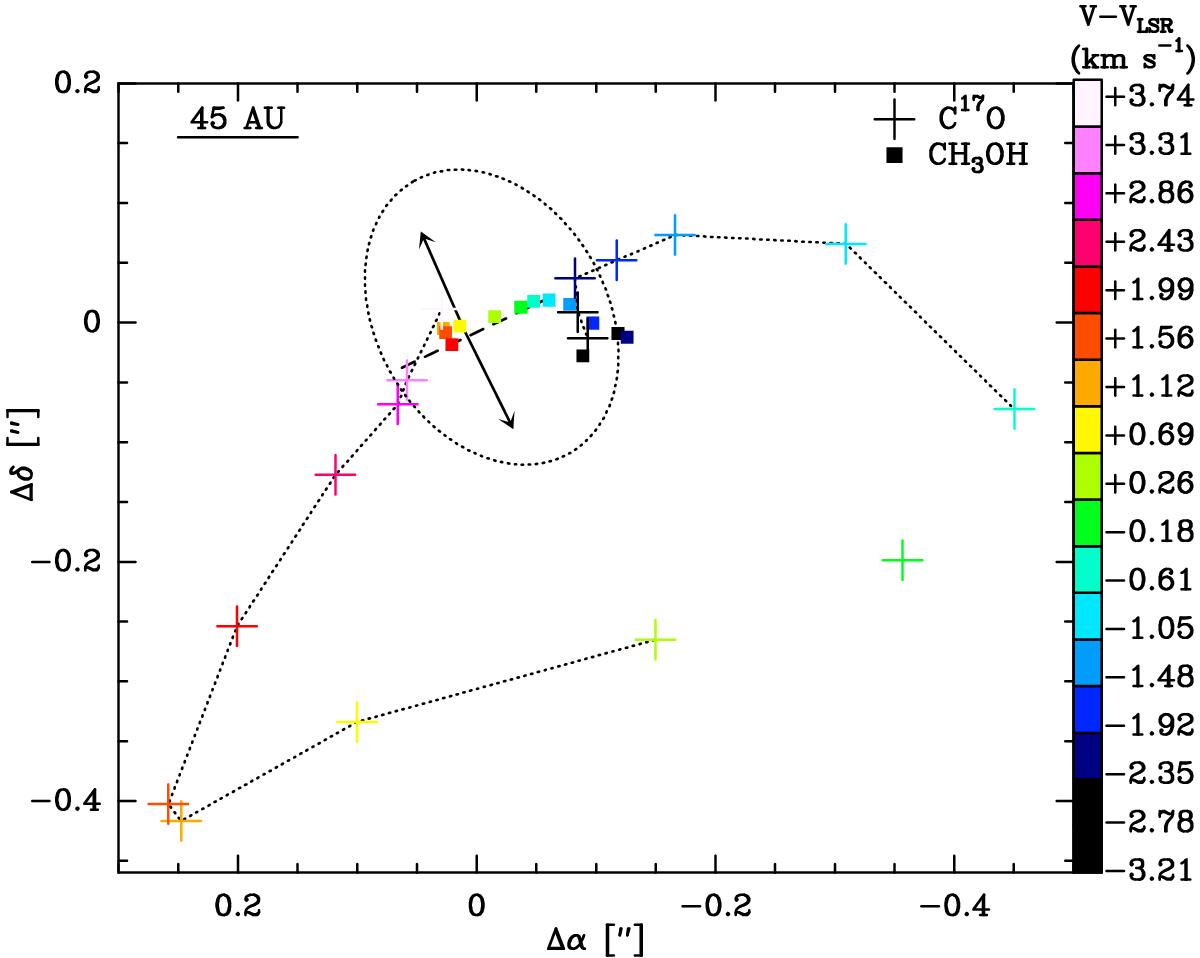
Distribution of the centroid positions of various velocity channels of the 71–61-A, νt = 0 line (squares) and of the C17O(2–1) transition (crosses). Velocities are colour-coded according to the scale shown in the figure and are subtracted by the systemic velocity. The arrows indicate the direction of the jet; the dashed line traces the equatorial plane. For clarity, the C17O(2–1) velocity channels are connected by dotted lines. The dotted ellipse represents the elliptical Gaussian fit to the averaged visibilities of the 71–61-A, νt = 0 line.
Current usage metrics show cumulative count of Article Views (full-text article views including HTML views, PDF and ePub downloads, according to the available data) and Abstracts Views on Vision4Press platform.
Data correspond to usage on the plateform after 2015. The current usage metrics is available 48-96 hours after online publication and is updated daily on week days.
Initial download of the metrics may take a while.