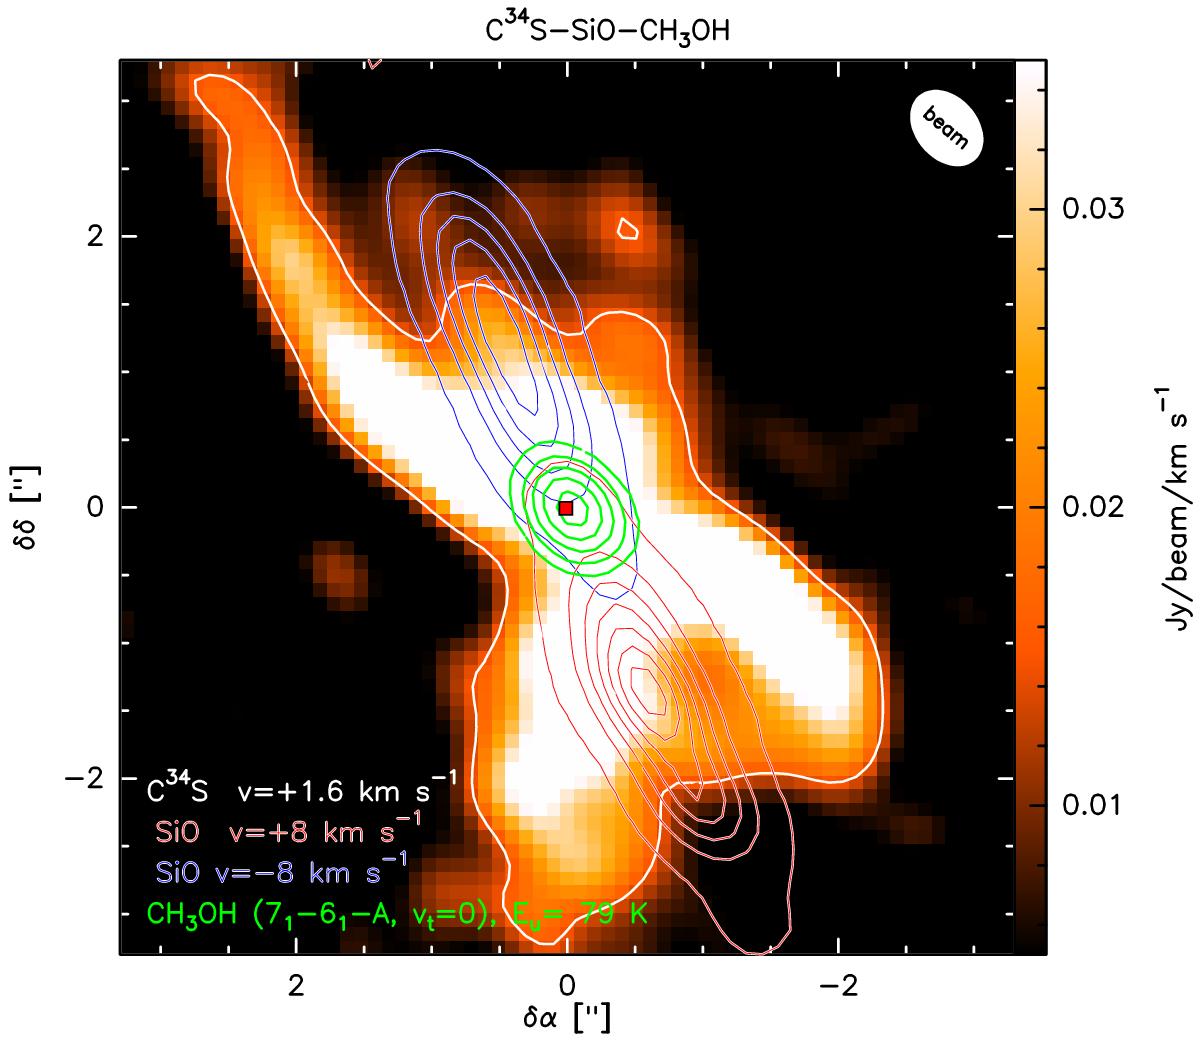
Fig. 1

The HH 212 protostellar system as observed by ALMA (Codella et al. 2014). The colour scale represents the C34S (7–6) emission close to the systemic velocity (the white contour is the 5σ level). Blue and red contours show the blue- and red-shifted SiO(8–7) jet at ±8 km s-1 from the systemic velocity. Green contours show the integrated emission of the 71–61-A, νt = 0 CH3OH line (from 10σ, 90 mJy beam-1 km-1 s, in steps of 10σ). The red square marks the peak of the continuum emission (Lee et al. 2014). The filled ellipse shows the synthesised beam.
Current usage metrics show cumulative count of Article Views (full-text article views including HTML views, PDF and ePub downloads, according to the available data) and Abstracts Views on Vision4Press platform.
Data correspond to usage on the plateform after 2015. The current usage metrics is available 48-96 hours after online publication and is updated daily on week days.
Initial download of the metrics may take a while.


