Fig. 5
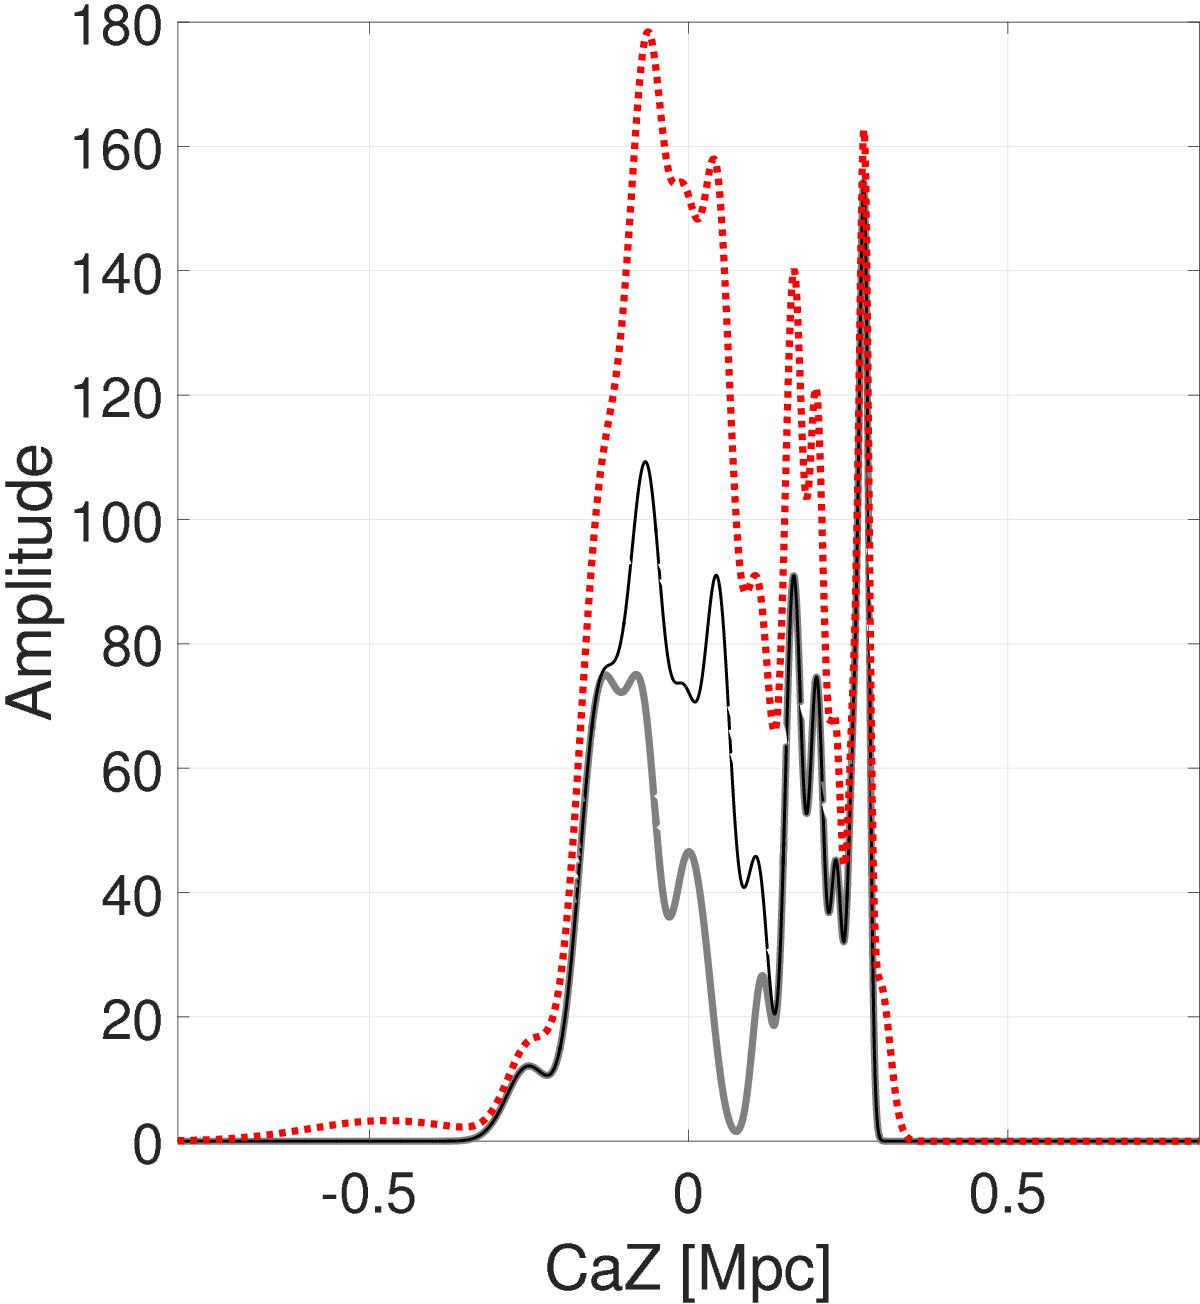
Same as Fig. 4 but including the PISCeS dwarfs and shown as density distribution, analoguous to the histogram of Fig. 3. The gray line corresponds to the members of the two planes from the T15 sample. The black line corresponds to the LV sample, comprising the T15 sample plus the nine new dwarfs from the PISCeS survey, thus representing all known galaxies with distances <1 Mpc from Cen A. The red dotted line is the grand total, i.e., the superposition of the black line and all the possible members of the Cen A subgroup from the Candidate sample (Müller et al. 2016; Crnojević et al. 2016), assuming a distance of 3.68 Mpc (Cen A) and an error of ±0.5 Mpc. The galaxy Cen A itself is located at CaZ = 0.
Current usage metrics show cumulative count of Article Views (full-text article views including HTML views, PDF and ePub downloads, according to the available data) and Abstracts Views on Vision4Press platform.
Data correspond to usage on the plateform after 2015. The current usage metrics is available 48-96 hours after online publication and is updated daily on week days.
Initial download of the metrics may take a while.