Fig. 4
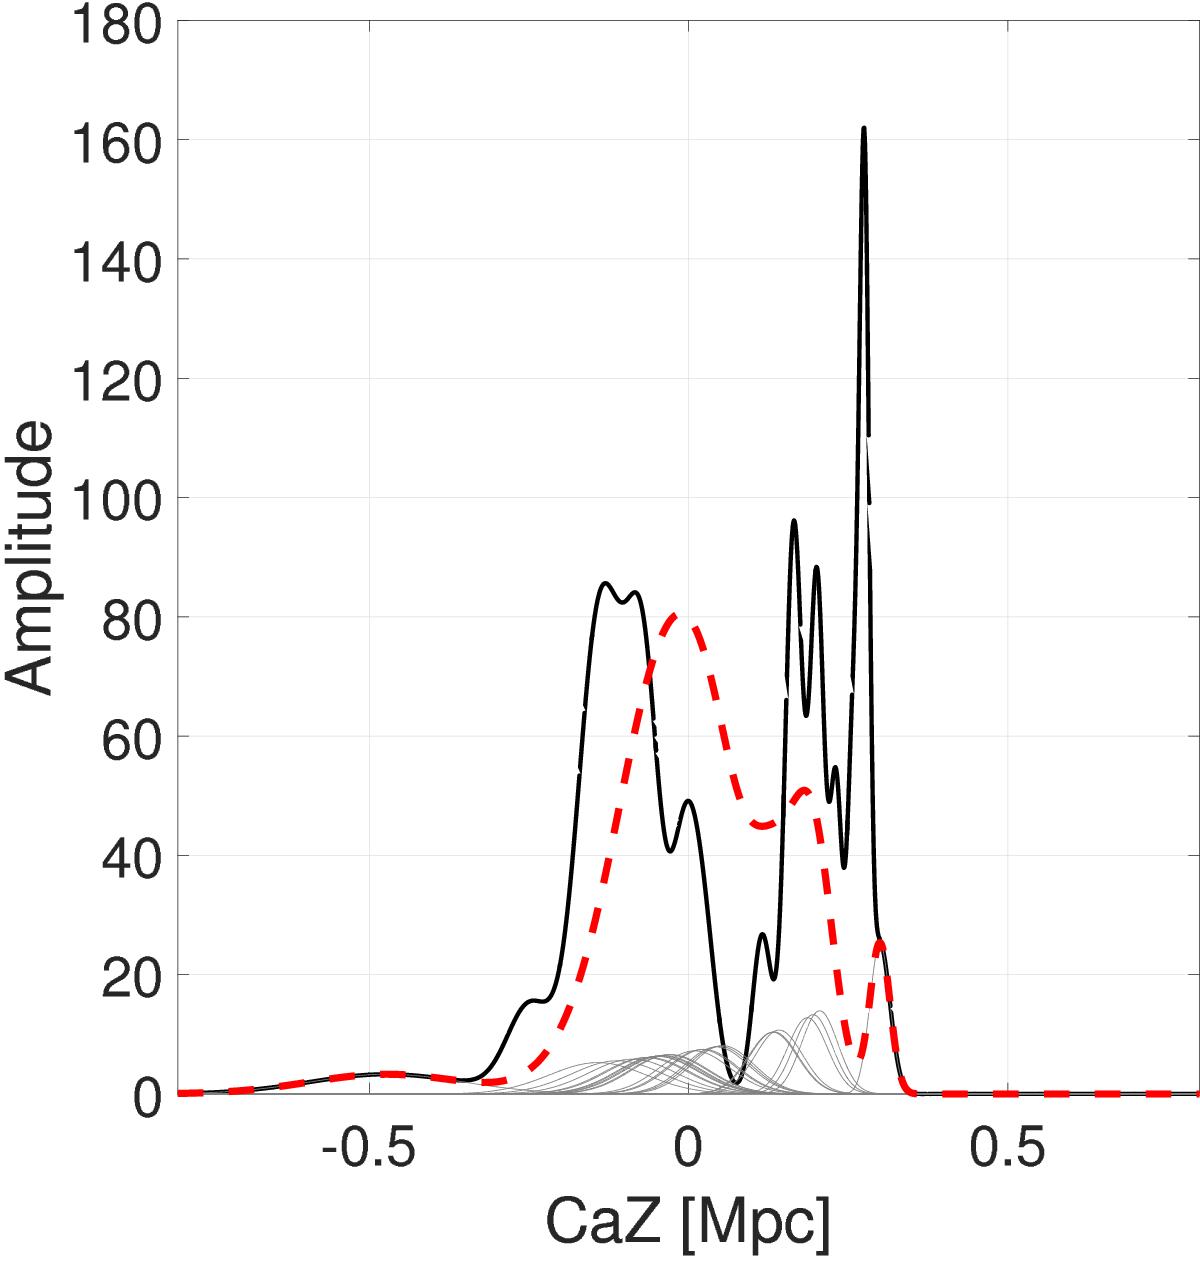
Adaptive kernel for the Cen A subgroup members. Shown is the density distribution of satellite galaxies along the CaZ axis from a superposition of projected standard normal curves accounting for distance uncertainties (see text). The black line corresponds to the T15 sample (members and candidates), and the red dotted line to the Candidate sample, assuming a distance of 3.68 Mpc (Cen A) and an uncertainty due to the depth of the subgroup of ±0.5 Mpc. The standard normal curves of the candidates are shown in gray.
Current usage metrics show cumulative count of Article Views (full-text article views including HTML views, PDF and ePub downloads, according to the available data) and Abstracts Views on Vision4Press platform.
Data correspond to usage on the plateform after 2015. The current usage metrics is available 48-96 hours after online publication and is updated daily on week days.
Initial download of the metrics may take a while.