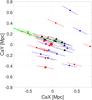
Fig. 2
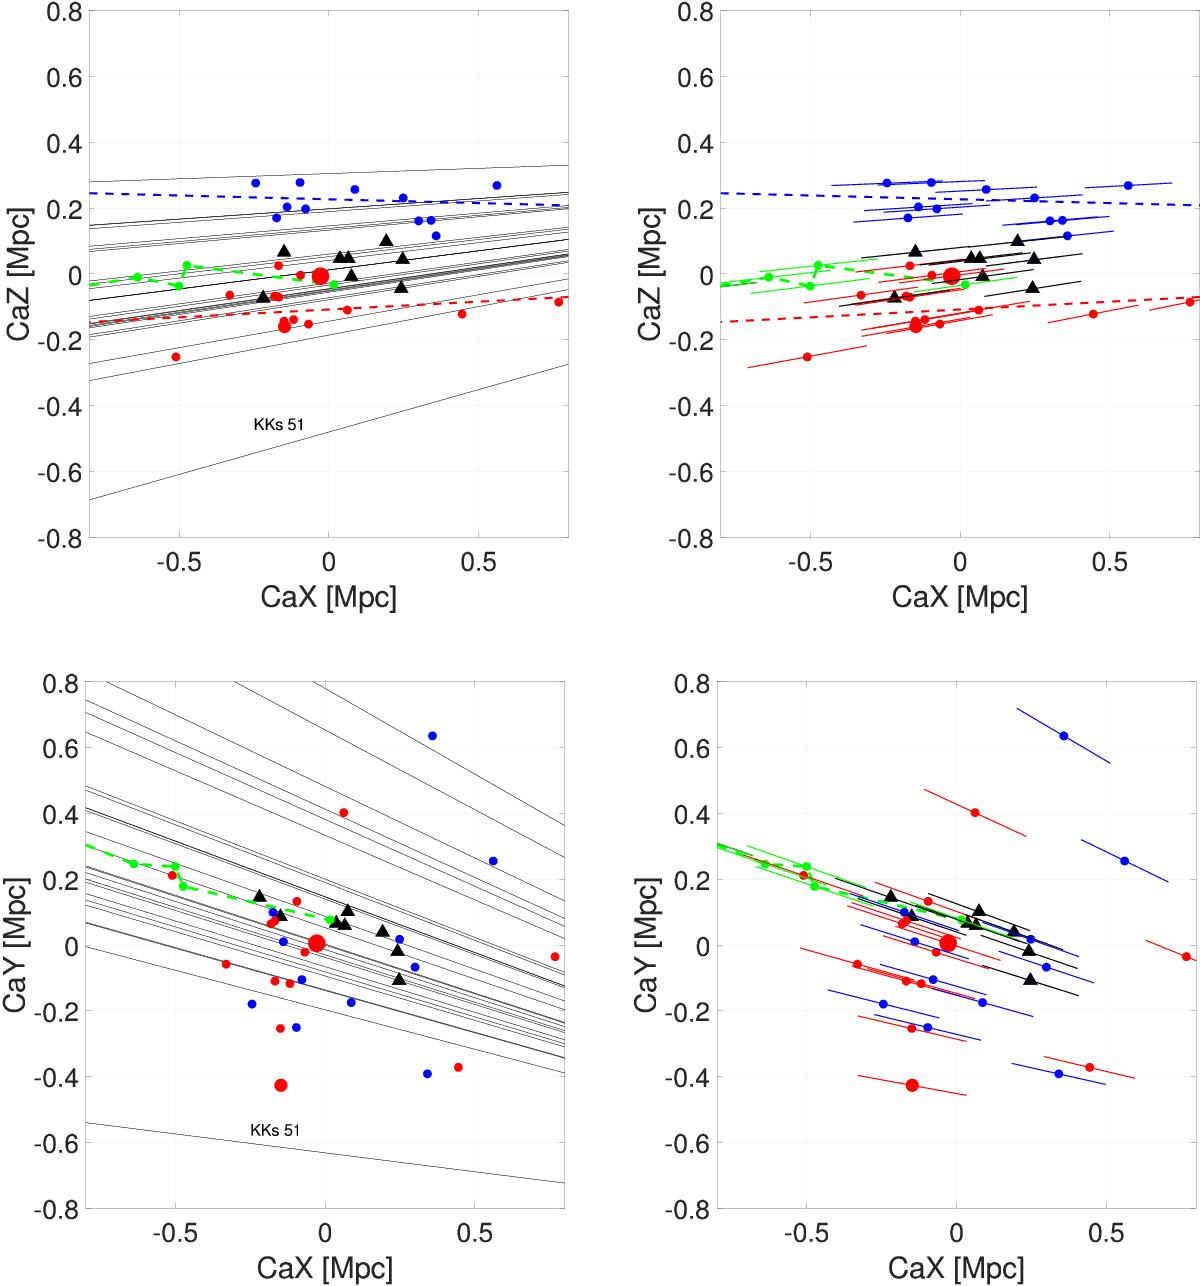
Top left: edge-on view of the two galaxy planes. Red dots are satellites in plane 1, blue dots are satellites in plane 2, and black triangles are new dwarfs from the PISCeS survey. The green dotted line corresponds to the tidally disrupted dwarf Cen A-MM-Dw3 where the dots themselves are regions in the tail where distances were measured (Dw3 S, Dw3 SE, Dw3 N, and Dw3 NW). Cen A-MM-Dw3 itself falls outside the frame. The red and blue dashed lines are the best-fitting planes. The 25 thin black lines indicate the possible locations of new dwarf candidates without distance measurements. Top right: same as top left but without the possible group members, giving instead an indication of the distance uncertainties of the known members. The colored lines correspond to 5 percent distance errors, projected onto the CaX-CaZ plane. Bottom left: galaxy distribution in the CaX-CaY plane, where we see the two planes superimposed and face-on. Bottom right: same as bottom left, only showing the galaxies with known distances. As in Fig. 1, the large red dot is Cen A and the intermediate-size red dot is the giant spiral NGC 4945.
Current usage metrics show cumulative count of Article Views (full-text article views including HTML views, PDF and ePub downloads, according to the available data) and Abstracts Views on Vision4Press platform.
Data correspond to usage on the plateform after 2015. The current usage metrics is available 48-96 hours after online publication and is updated daily on week days.
Initial download of the metrics may take a while.