Fig. 9
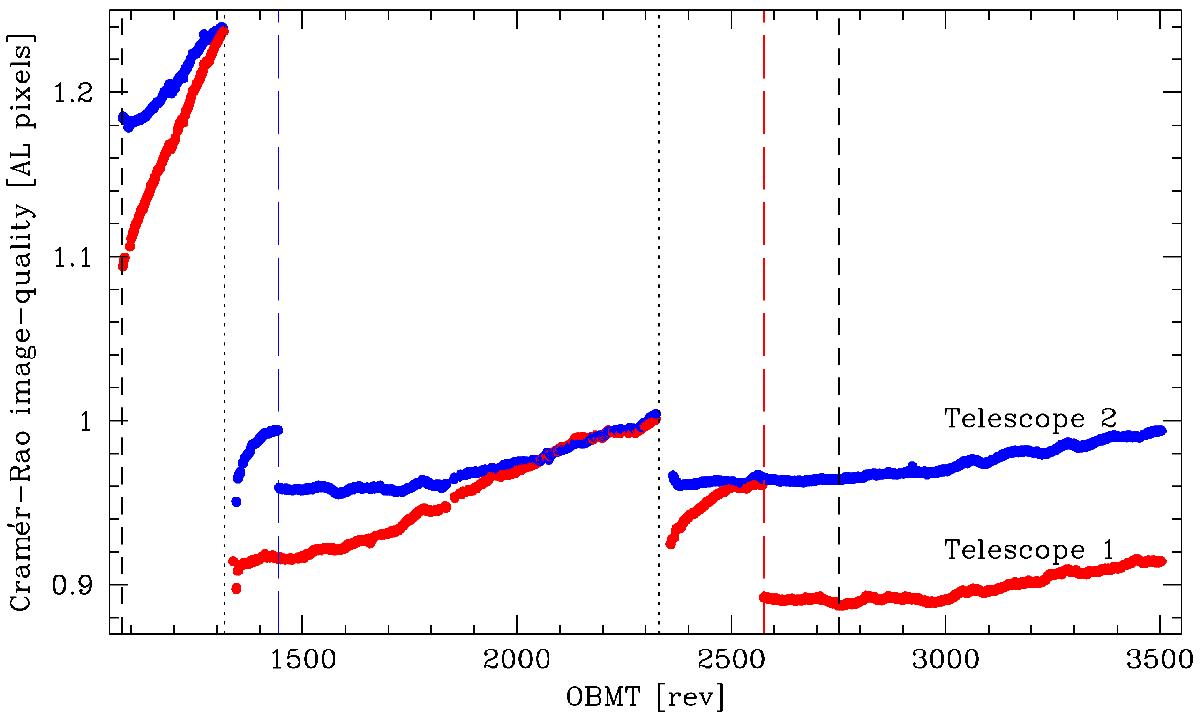
Evolution of the astrometric image quality (averaged over all AF CCDs) as a function of time as quantified by the Cramér-Rao centroiding diagnostic. A lower value indicates a better image quality and centroiding performance. Red lines refer to the preceding field of view; blue lines to the following field of view. The discontinuities refer to the decontaminations (dotted vertical lines) and refocussings (dashed blue and red lines; Sect. 6.4). OBMT stands for onboard mission timeline in units of six-hour revolutions since launch (Sect. 5.3.3). Gaia DR1 is based on data covering the interval OBMT = 1078.3795–2751.3518, delimited by dashed black lines.
Current usage metrics show cumulative count of Article Views (full-text article views including HTML views, PDF and ePub downloads, according to the available data) and Abstracts Views on Vision4Press platform.
Data correspond to usage on the plateform after 2015. The current usage metrics is available 48-96 hours after online publication and is updated daily on week days.
Initial download of the metrics may take a while.