Fig. 10
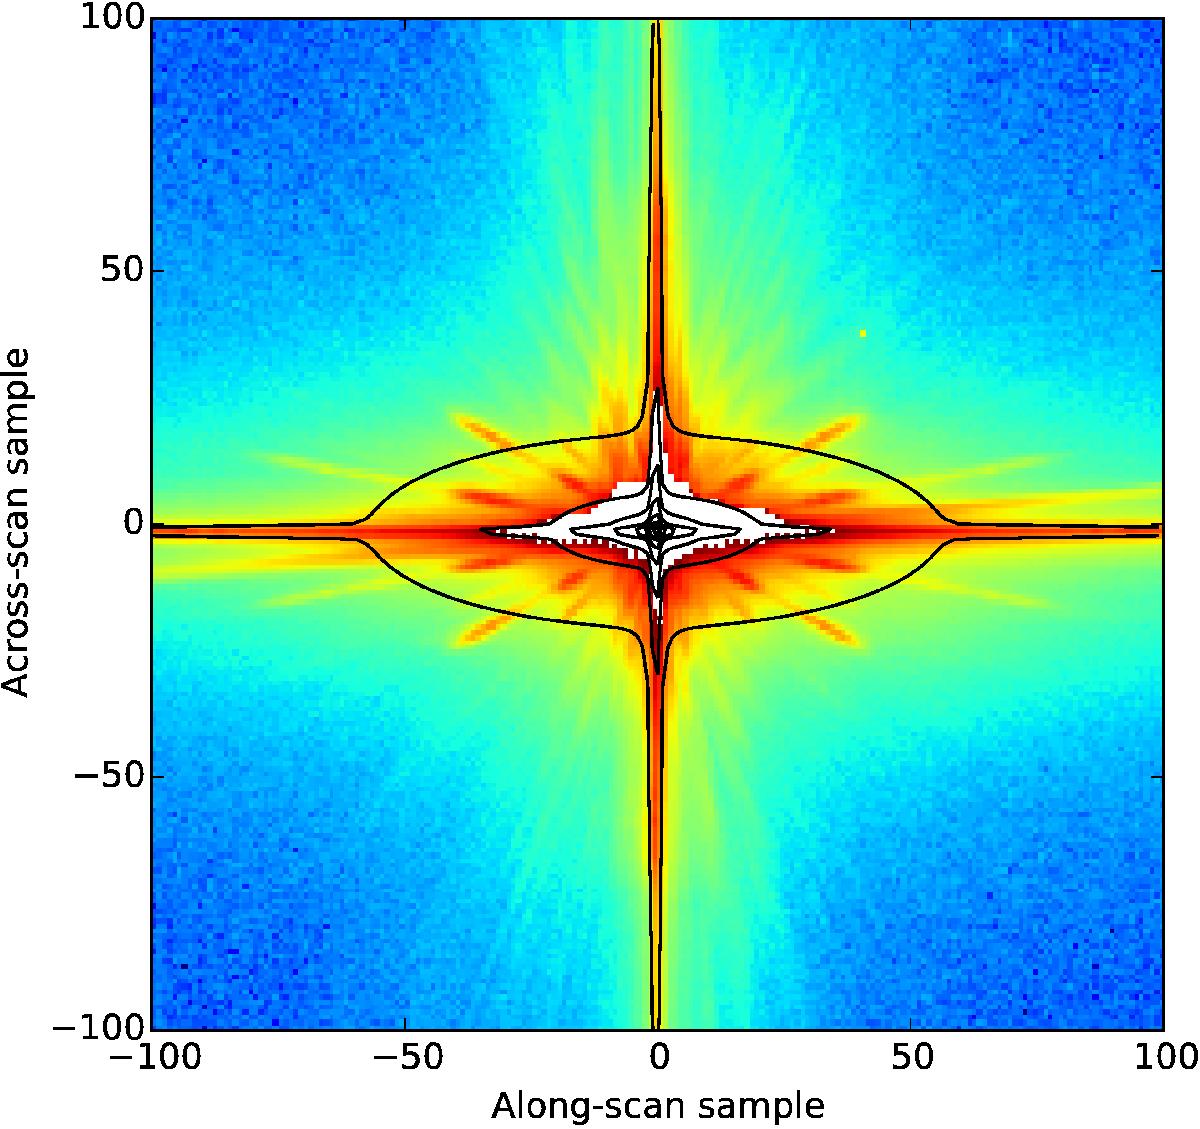
Example sky-mapper SIF image of a very bright star (HIP 48036, R Leo, a Mira-type variable star). The image shows the central 200 × 200 samples (each composed of 2 × 2 pixels) only. The colour scale is logarithmic and denotes counts, with white indicating saturation. The large, asymmetric saturation blob and the saw-edge pattern to the saturation are not optical properties of the point spread function but the result of known saturation behaviour of the readout node. The contours, evenly spaced in log-intensity space, indicate a model point spread function, aligned by eye, for a solar-type star in the astrometric field. Differences between the data and the model are due to the different spectral type, different part of the focal plane (sky mapper versus astrometric field), different across-scan motion, and the absence of read-out effects, saturation, charge-transfer inefficiency, and a high-frequency, wave-front-error feature of the primary mirror (quilting effect, resulting in diagonal spikes) in the model.
Current usage metrics show cumulative count of Article Views (full-text article views including HTML views, PDF and ePub downloads, according to the available data) and Abstracts Views on Vision4Press platform.
Data correspond to usage on the plateform after 2015. The current usage metrics is available 48-96 hours after online publication and is updated daily on week days.
Initial download of the metrics may take a while.