Fig. 3
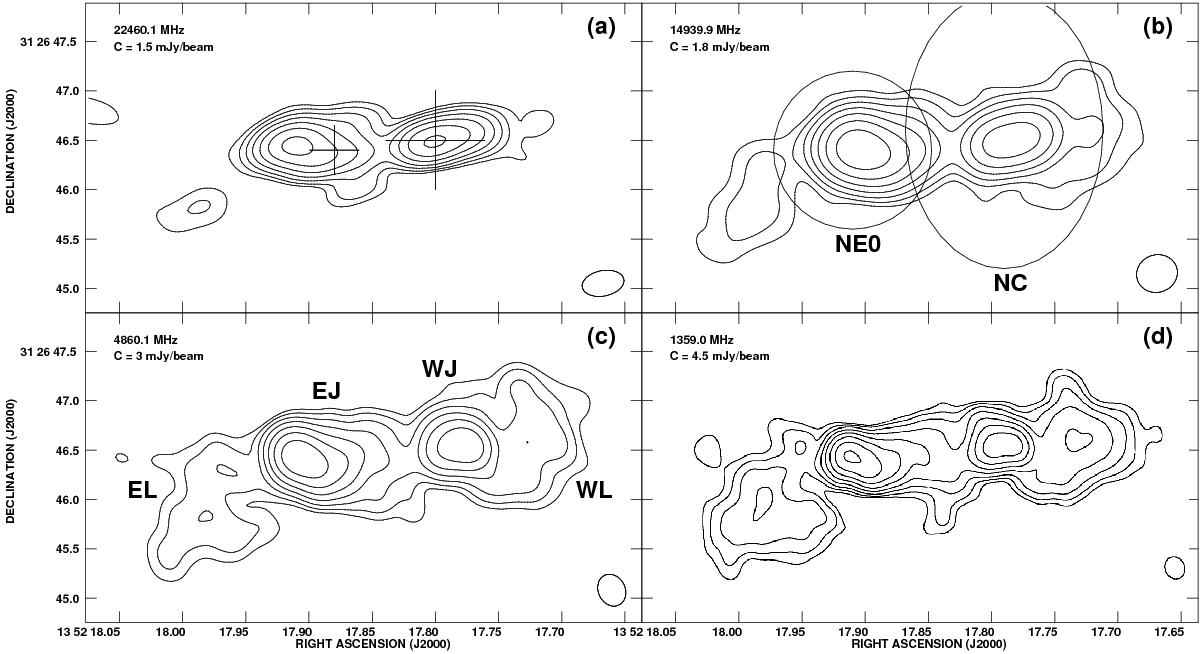
Radio images of the inner radio structure of 3C 293 at four different observing frequencies: a) VLA B-array 22.46 GHz; the large cross in the image indicates the position of the western optical nucleus/the active radio core, while the small cross denotes the position of the eastern optical nucleus; b) VLA B-array 14.94 GHz; the ellipse and the circle indicate the two smaller apertures selected by Lanz et al. (2015) for the Chandra X-ray data analysis; c) VLA A-array 4.86 GHz; the labelling denotes the western lobe (WL), the western jet (WJ), the eastern lobe (EL), and the eastern jet (EJ); d) MERLIN 1.36 GHz reproduced from Beswick et al. (2002). In all panels, the contour levels given are (1, 2, 4, 8, ...) ×C mJy beam-1, where the value of the C constant are provided in each image. For all images, the restoring beam is indicated by an ellipse in the bottom right corner.
Current usage metrics show cumulative count of Article Views (full-text article views including HTML views, PDF and ePub downloads, according to the available data) and Abstracts Views on Vision4Press platform.
Data correspond to usage on the plateform after 2015. The current usage metrics is available 48-96 hours after online publication and is updated daily on week days.
Initial download of the metrics may take a while.