Fig. 2
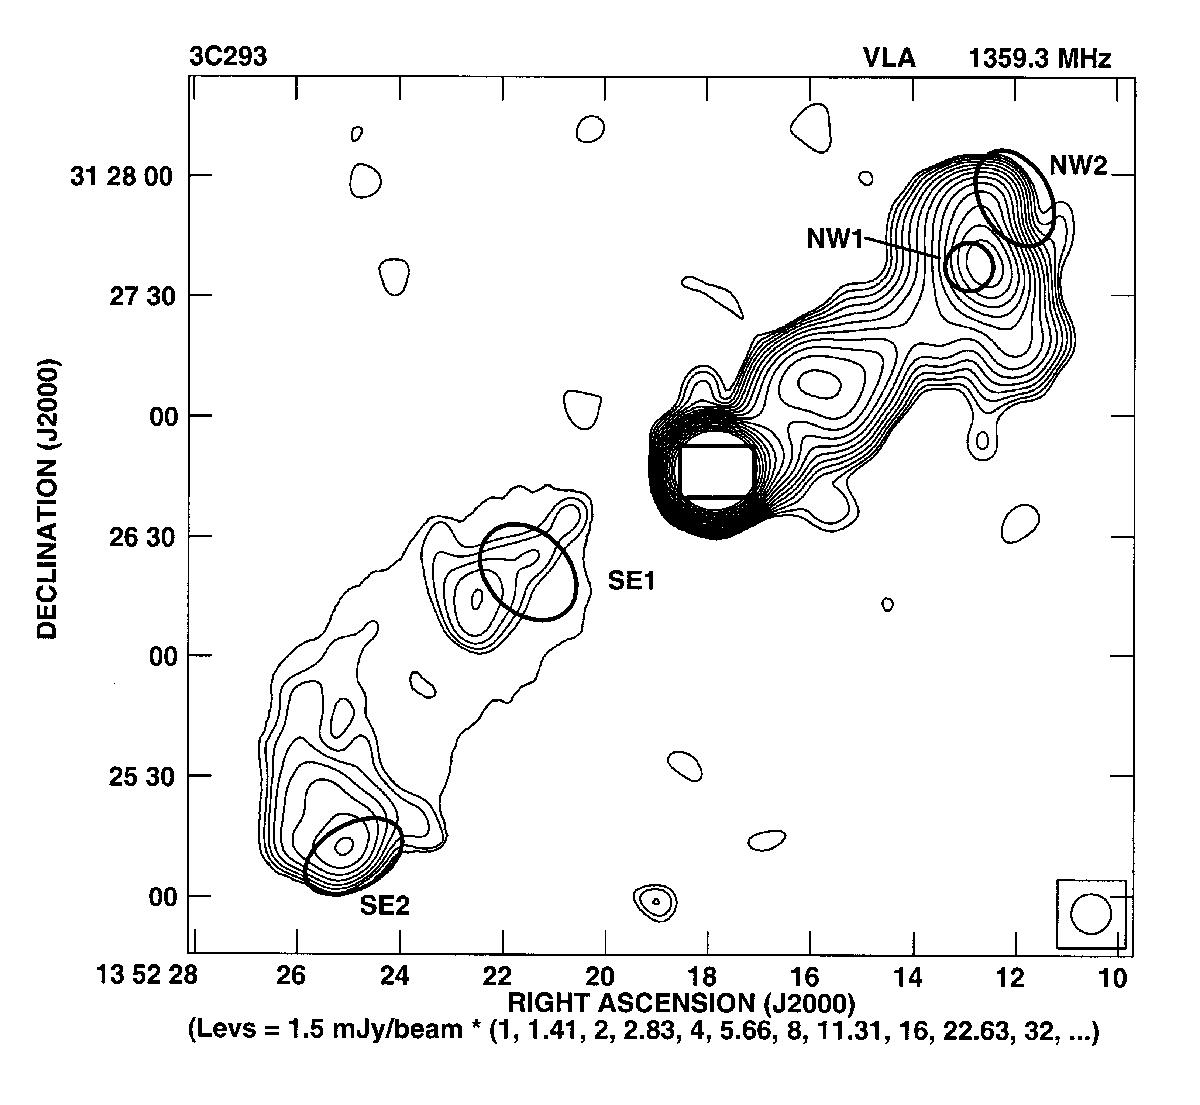
VLA B-array 1.36 GHz map of the large-scale structure of the radio source 3C 293, hosted by the galaxy UGC 8782. The rectangle inside the central core region corresponds to the frame of Fig. 1. The small circle and three ellipses denote the regions where the X-ray emission was detected and modelled by Lanz et al. (2015). The restoring beam (10″ × 10″) is indicated by a circle in the bottom right corner.
Current usage metrics show cumulative count of Article Views (full-text article views including HTML views, PDF and ePub downloads, according to the available data) and Abstracts Views on Vision4Press platform.
Data correspond to usage on the plateform after 2015. The current usage metrics is available 48-96 hours after online publication and is updated daily on week days.
Initial download of the metrics may take a while.