Fig. 9
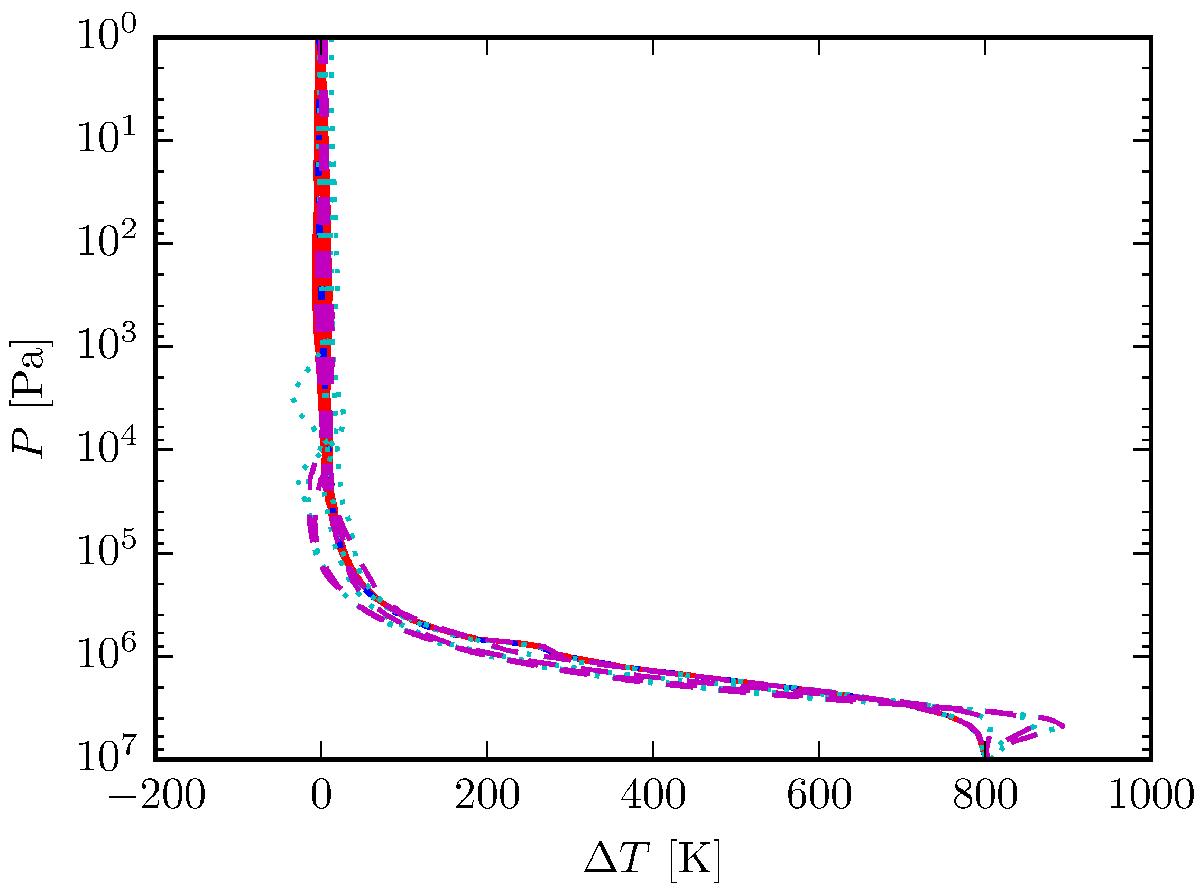
Temperature difference ΔT between the P–T profiles in the right-hand panel of Fig. 8, which are from the model with a 800 K hotter initial condition compared to the global 1D mean, and the P–T profiles in Fig. 7, which are from the model initialised with the global 1D mean P–T profile. Temperature differences are small for P ≲105 bar, while the models have clearly not reached a steady-state for P ≳105 bar. Results are similar for the case with a 400 K hotter initial condition. Lines are as in Fig. 7.
Current usage metrics show cumulative count of Article Views (full-text article views including HTML views, PDF and ePub downloads, according to the available data) and Abstracts Views on Vision4Press platform.
Data correspond to usage on the plateform after 2015. The current usage metrics is available 48-96 hours after online publication and is updated daily on week days.
Initial download of the metrics may take a while.