Fig. 6
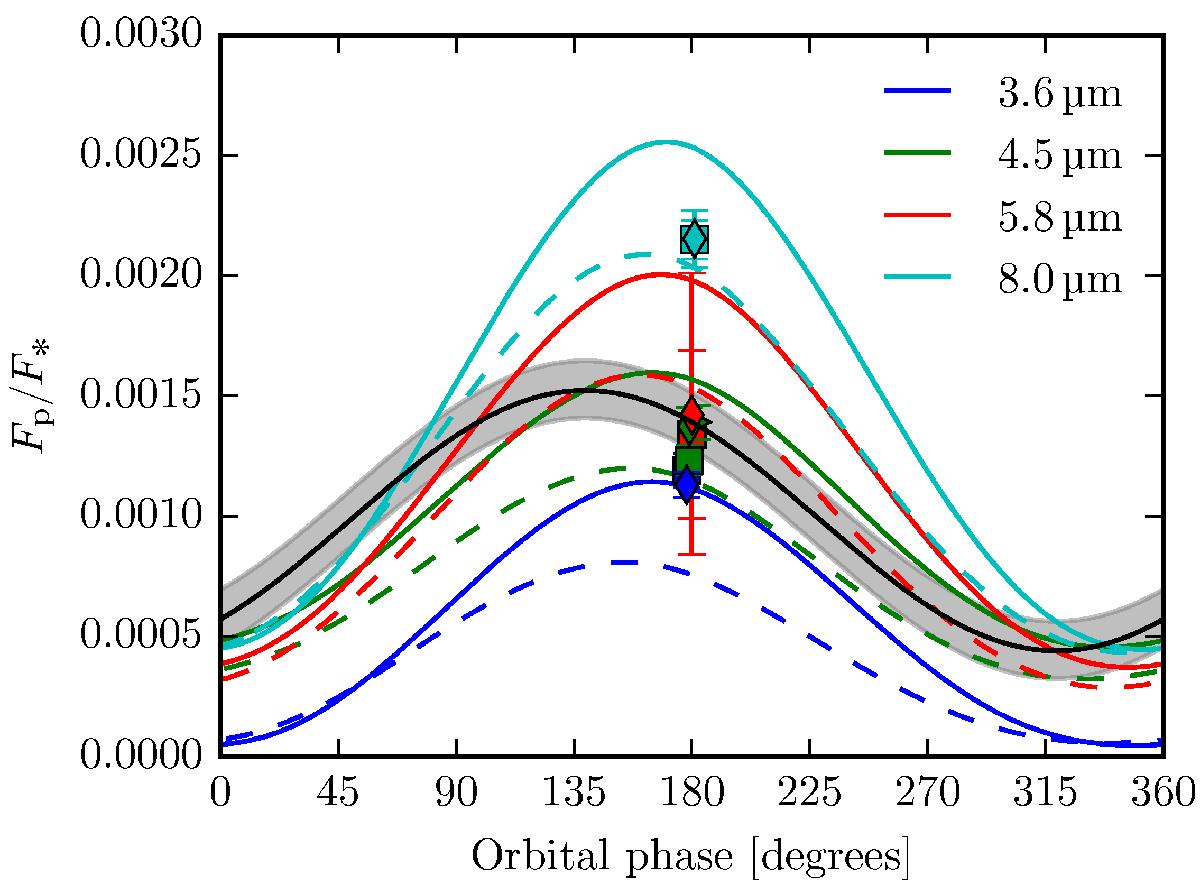
Synthetic Spitzer IRAC phase curves from the Newtonian forcing model. The solid lines are calculated from the model presented in Mayne et al. (2014a) and Sect. 3 using ATMO, the dashed lines are the synthetic phase curves from Fortney et al. (2006), which are based on the models of Cooper & Showman (2005, 2006) using the same Newtonian forcing scheme. The models have been integrated over the IRAC bands using the filter functions. The data points are from Zellem et al. (2014) (►), Diamond-Lowe et al. (2014) (■) and Evans et al. (2015) (♦). The best fit to the observed 4.5 μm phase curve from Zellem et al. (2014) is shown as a solid black line, the grey shaded area is the 1σ uncertainty for the offset of the observed planet to star flux ratio.
Current usage metrics show cumulative count of Article Views (full-text article views including HTML views, PDF and ePub downloads, according to the available data) and Abstracts Views on Vision4Press platform.
Data correspond to usage on the plateform after 2015. The current usage metrics is available 48-96 hours after online publication and is updated daily on week days.
Initial download of the metrics may take a while.