Fig. 5
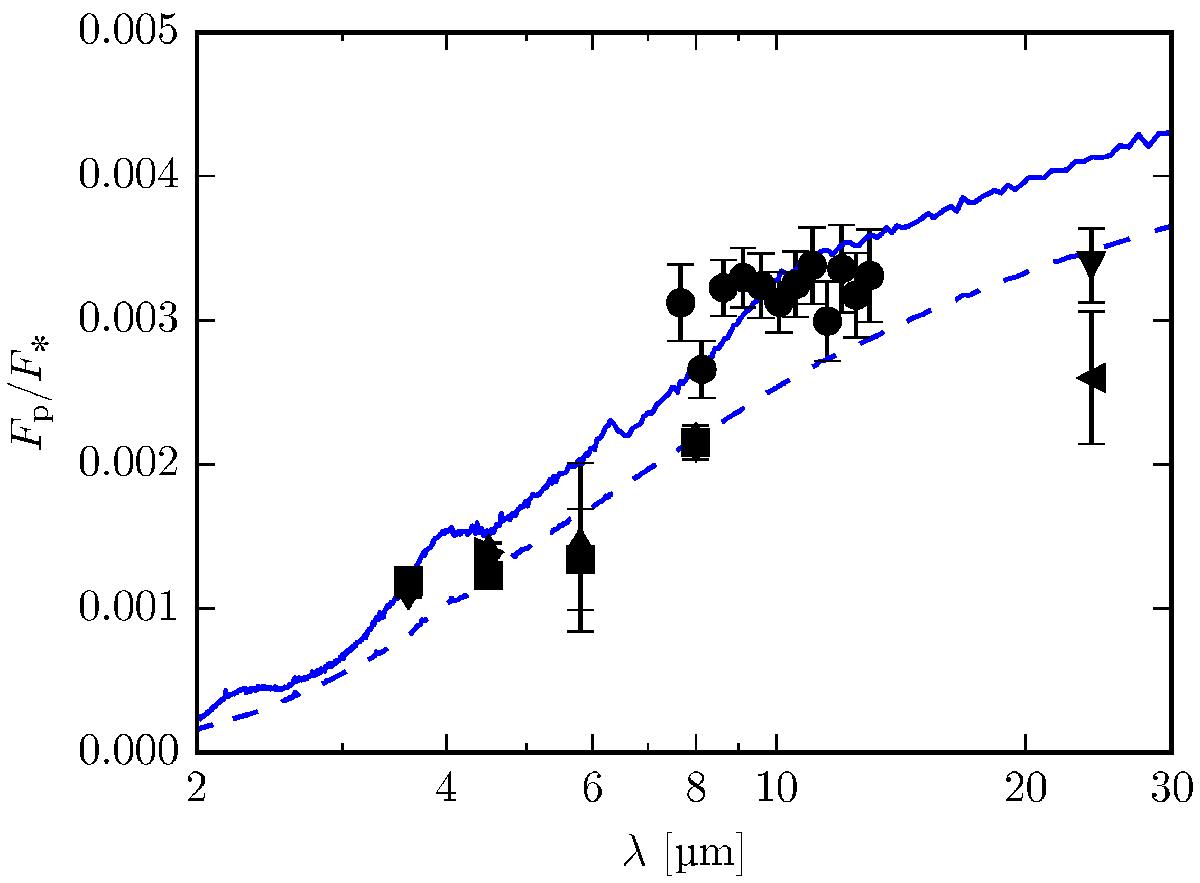
Observed (points) and synthetic (lines) emission spectra for HD 209458b models with Newtonian cooling. The solid line has been calculated from the model presented in Mayne et al. (2014a) and Sect. 3 using ATMO, the dashed line is the synthetic emission spectrum from Fortney et al. (2006), which is based on the models of Cooper & Showman (2005, 2006) using the same Newtonian forcing scheme. The black points are observations from Swain et al. (2008) (●), Crossfield et al. (2012) (▼), Deming et al. (2005) (◄), Zellem et al. (2014) (►), Diamond-Lowe et al. (2014) (■) and Evans et al. (2015) (♦).
Current usage metrics show cumulative count of Article Views (full-text article views including HTML views, PDF and ePub downloads, according to the available data) and Abstracts Views on Vision4Press platform.
Data correspond to usage on the plateform after 2015. The current usage metrics is available 48-96 hours after online publication and is updated daily on week days.
Initial download of the metrics may take a while.