Free Access
Fig. 3
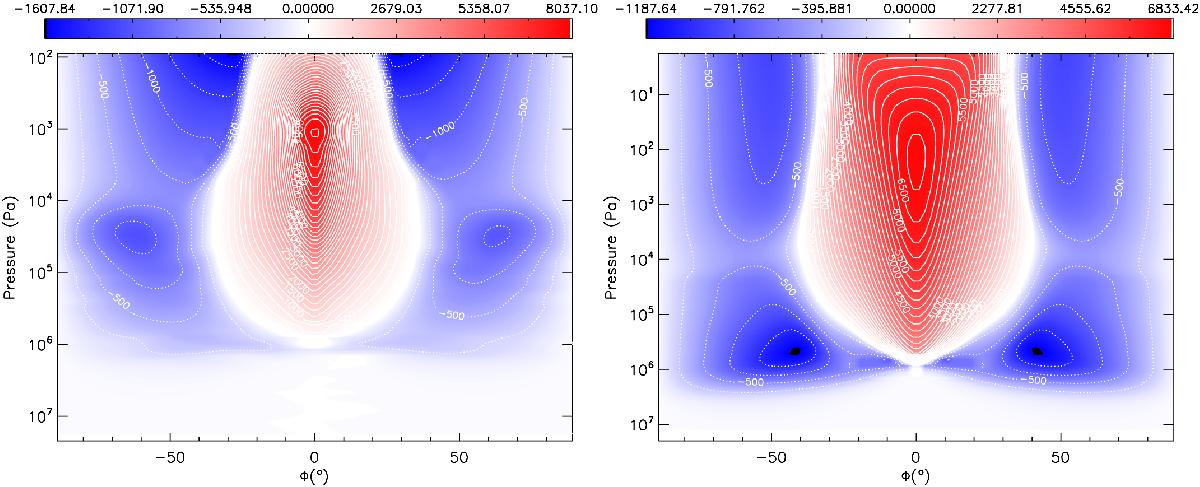
Zonal mean of the zonal wind velocity [m s− 1] after 1600 d for the models of HD 209458b. Left: model with Newtonian forcing from Mayne et al. (2014a) discussed in Sect. 3. Right: coupled model discussed in Sect. 4. Red indicates a prograde wind, blue indicates a retrograde wind.
Current usage metrics show cumulative count of Article Views (full-text article views including HTML views, PDF and ePub downloads, according to the available data) and Abstracts Views on Vision4Press platform.
Data correspond to usage on the plateform after 2015. The current usage metrics is available 48-96 hours after online publication and is updated daily on week days.
Initial download of the metrics may take a while.