Fig. 2
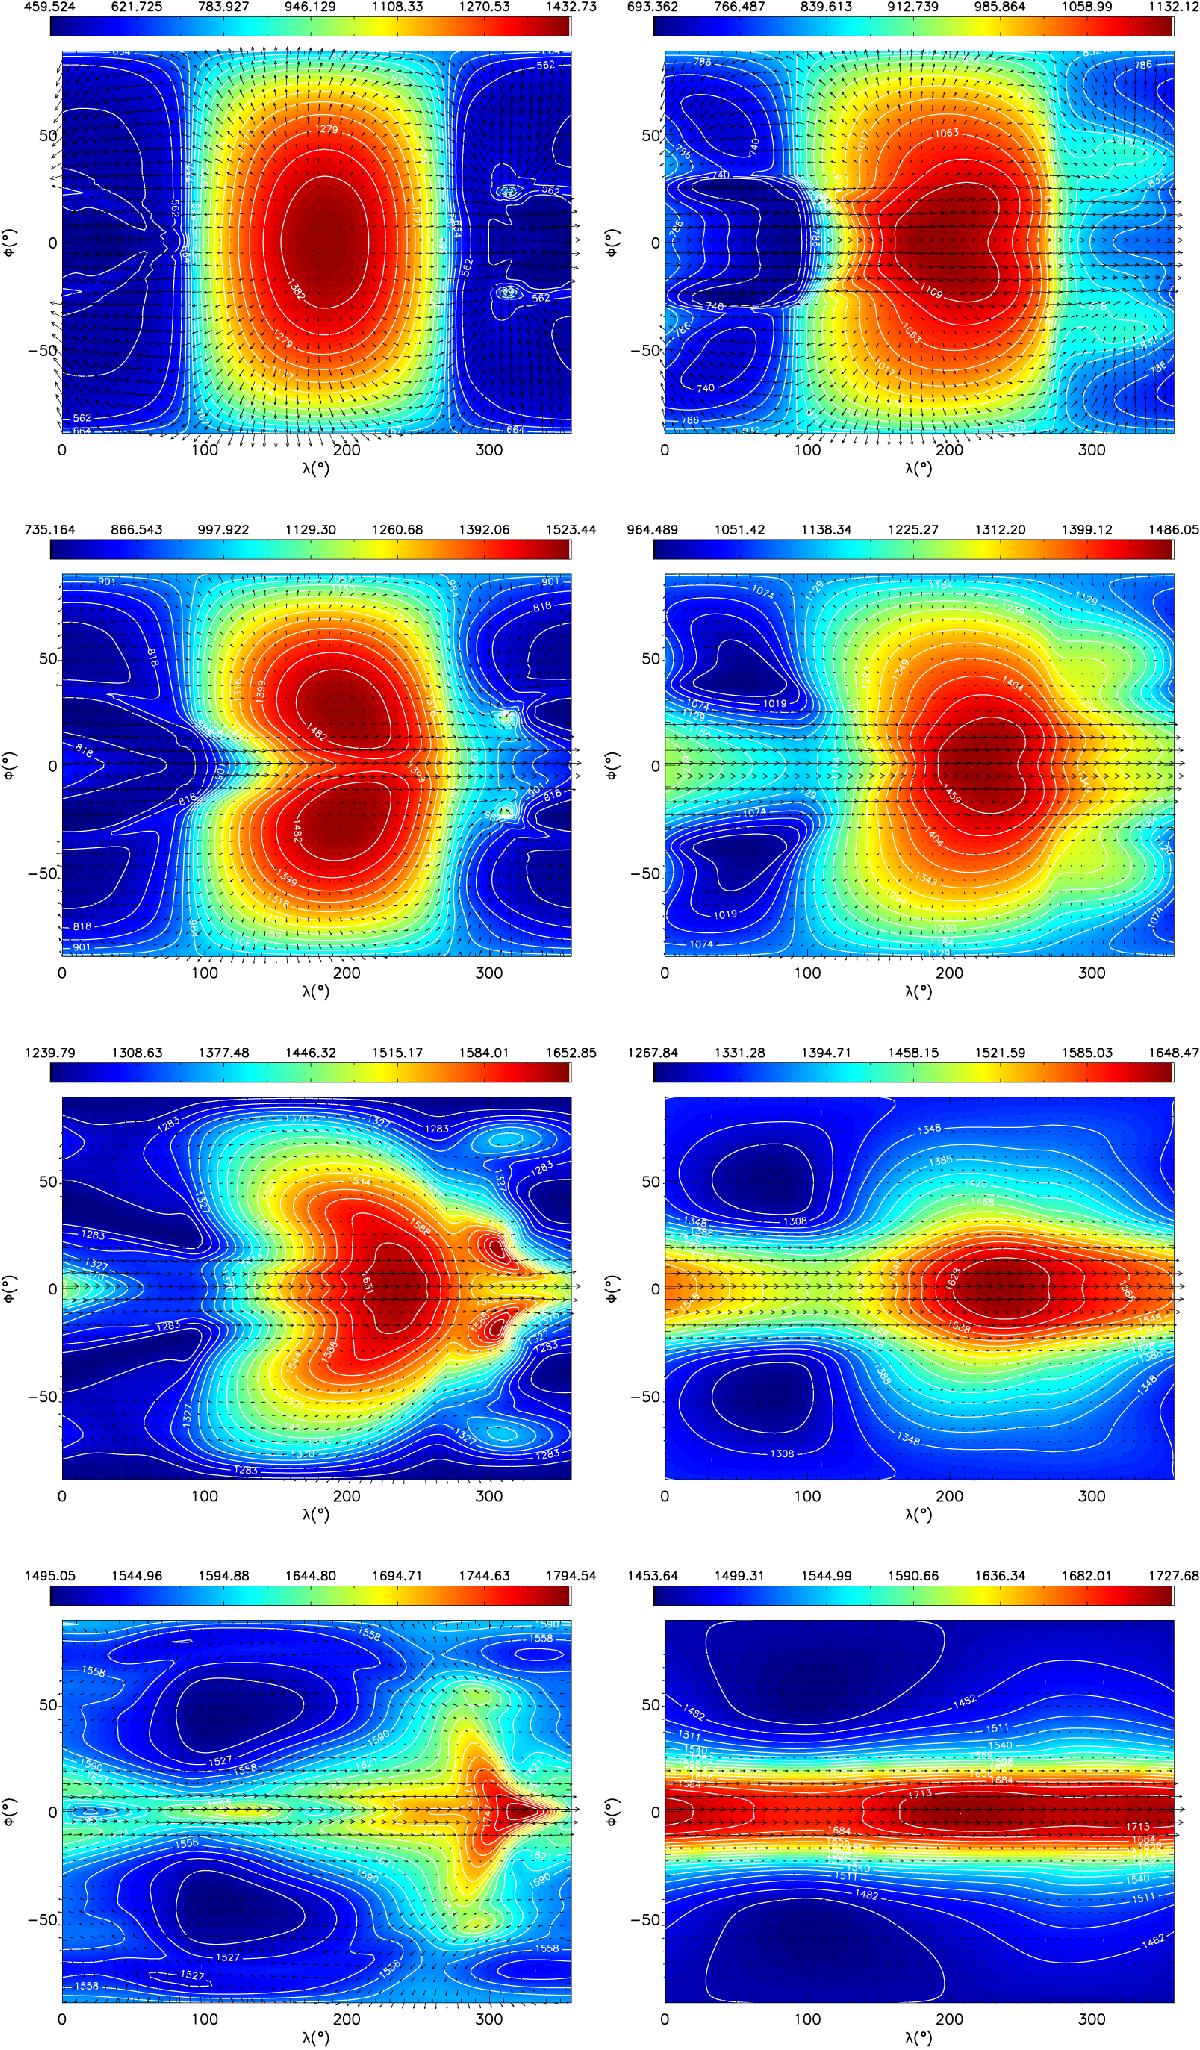
Horizontal wind velocity as arrows and temperature [K] as colours and contours from our models of HD 209458b after 1600 d. Left column: results from the model with Newtonian forcing discussed in Sect. 3 at 100 Pa, 3 × 10³ Pa, 3 × 10⁴ Pa, 1 × 10⁵ Pa (from top to bottom, from Mayne et al. 2014a). Right column: results from the coupled model discussed in Sect. 4 at 3 Pa, 3 × 10³ Pa, 3 × 10⁴ Pa, 1 × 10⁵ Pa (from top to bottom).
Current usage metrics show cumulative count of Article Views (full-text article views including HTML views, PDF and ePub downloads, according to the available data) and Abstracts Views on Vision4Press platform.
Data correspond to usage on the plateform after 2015. The current usage metrics is available 48-96 hours after online publication and is updated daily on week days.
Initial download of the metrics may take a while.