Fig. A.2
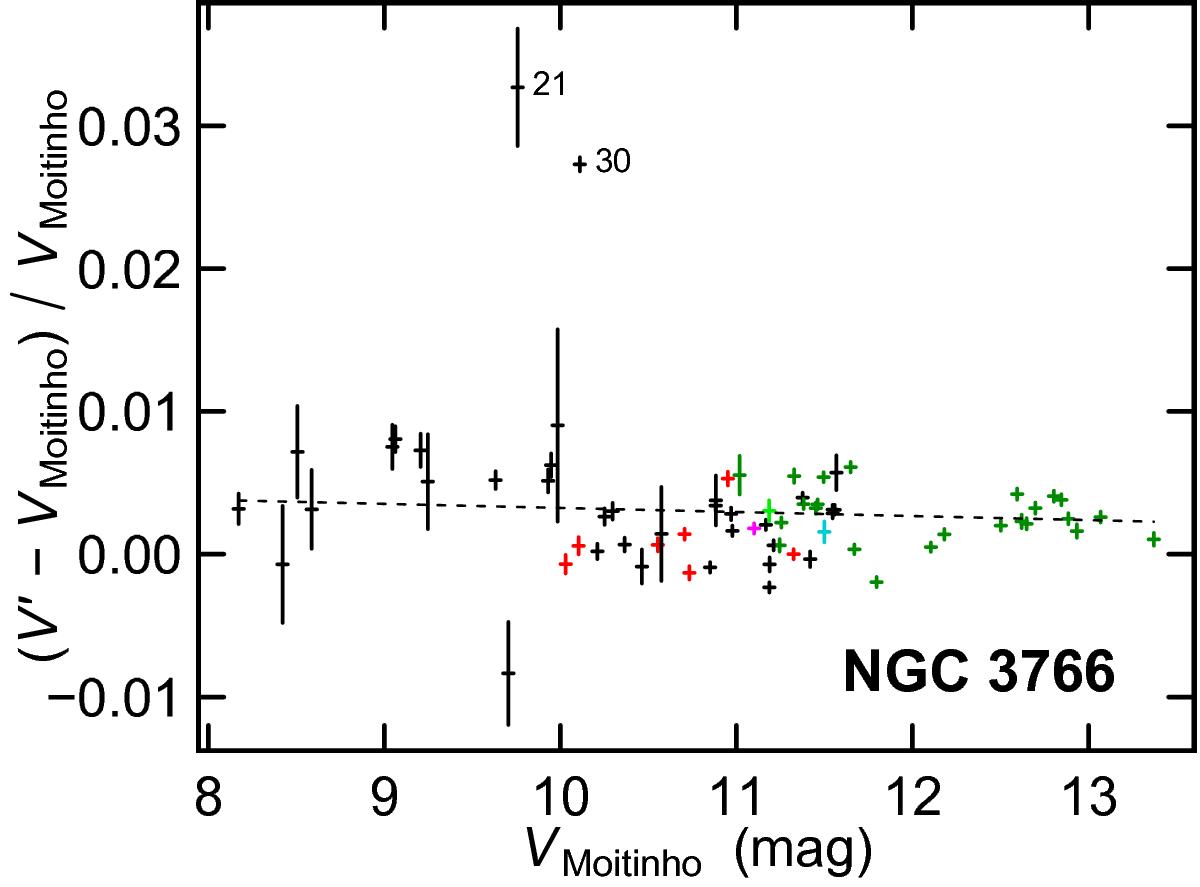
V′ magnitudes from Paper I compared to Johnson V band magnitudes from Moitinho et al. (1997), the latter labeled VMoitinho in the figure. Red indicators identify SPB candidates, and green indicators, new variability class candidates. The vertical lengths of the indicators equal the uncertainties in V′, taken to be the largest value between the V′ error bar from Paper I and the standard deviation of V′ light curve. The horizontal lengths equal the uncertainties in VMoitinho taken from Table 3 of Moitinho et al. (1997). A weighted fit to the data, excluding stars 21 and 30 because they show bursts in their light curves, leads to V′ = (1.000 ± 0.004)VMoitinho + (0.031 ± 0.041) mag. The fit, converted to the relative deviation of V′ with respect to VMoitinho, is shown with the dashed line in the figure.
Current usage metrics show cumulative count of Article Views (full-text article views including HTML views, PDF and ePub downloads, according to the available data) and Abstracts Views on Vision4Press platform.
Data correspond to usage on the plateform after 2015. The current usage metrics is available 48-96 hours after online publication and is updated daily on week days.
Initial download of the metrics may take a while.