Fig. 3
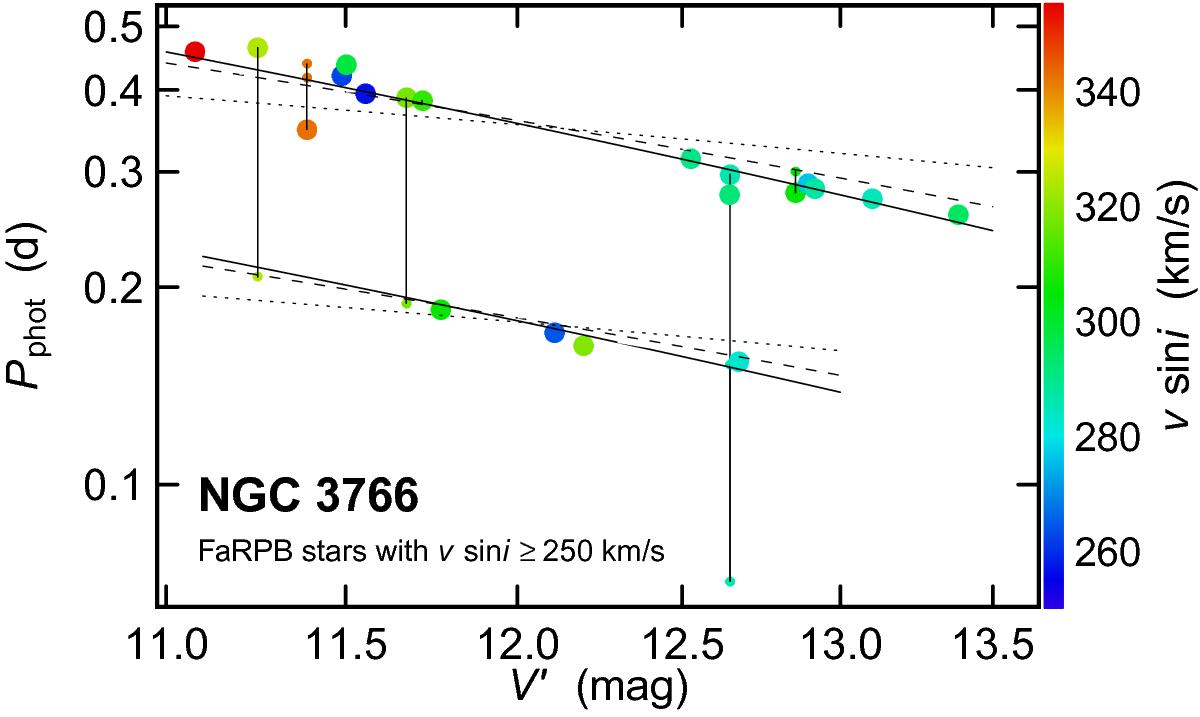
Period-magnitude diagram for FaRPB stars with ![]() km s-1. Solid vertical lines link periods within each multi-periodic star, with the second and third periods drawn with smaller indicators. The two solid lines locate the PL relation discovered in this Letter from a combined fit to the data on the two sequences. The dashed and dotted lines illustrate relations that would result from analytical arguments linking the PL relation to stellar rotation and Cepheid-like pulsation, respectively (see text). The vsini values are color-coded according to the color scale on the right of the figure.
km s-1. Solid vertical lines link periods within each multi-periodic star, with the second and third periods drawn with smaller indicators. The two solid lines locate the PL relation discovered in this Letter from a combined fit to the data on the two sequences. The dashed and dotted lines illustrate relations that would result from analytical arguments linking the PL relation to stellar rotation and Cepheid-like pulsation, respectively (see text). The vsini values are color-coded according to the color scale on the right of the figure.
Current usage metrics show cumulative count of Article Views (full-text article views including HTML views, PDF and ePub downloads, according to the available data) and Abstracts Views on Vision4Press platform.
Data correspond to usage on the plateform after 2015. The current usage metrics is available 48-96 hours after online publication and is updated daily on week days.
Initial download of the metrics may take a while.