Fig. D.2
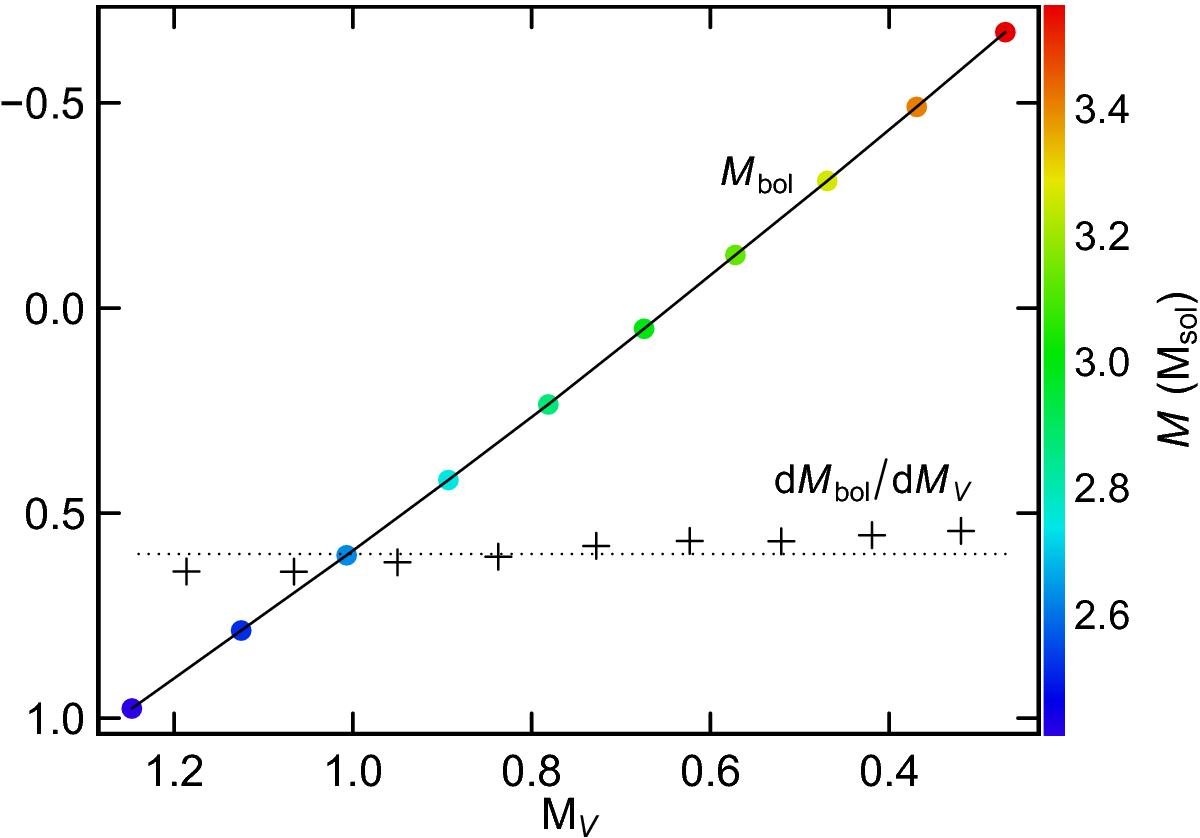
Mbol as a function of MV (filled color circles connected with a line, the colors being related to stellar mass according to the colorscale shown on the right of the figure), from isochrones at log (t) = 7.4 (t being the time in yr) published by Georgy et al. (2014), in the stellar mass range from 2.4 M⊙ to 3.6 M⊙. The derivative dMbol/ dMV computed numerically between two adjacent data points is plotted with + symbols. A dotted line is drawn at the Y-axis value of 0.6, which is the value adopted for this derivative in the analytical considerations presented in the Letter.
Current usage metrics show cumulative count of Article Views (full-text article views including HTML views, PDF and ePub downloads, according to the available data) and Abstracts Views on Vision4Press platform.
Data correspond to usage on the plateform after 2015. The current usage metrics is available 48-96 hours after online publication and is updated daily on week days.
Initial download of the metrics may take a while.