Fig. 9
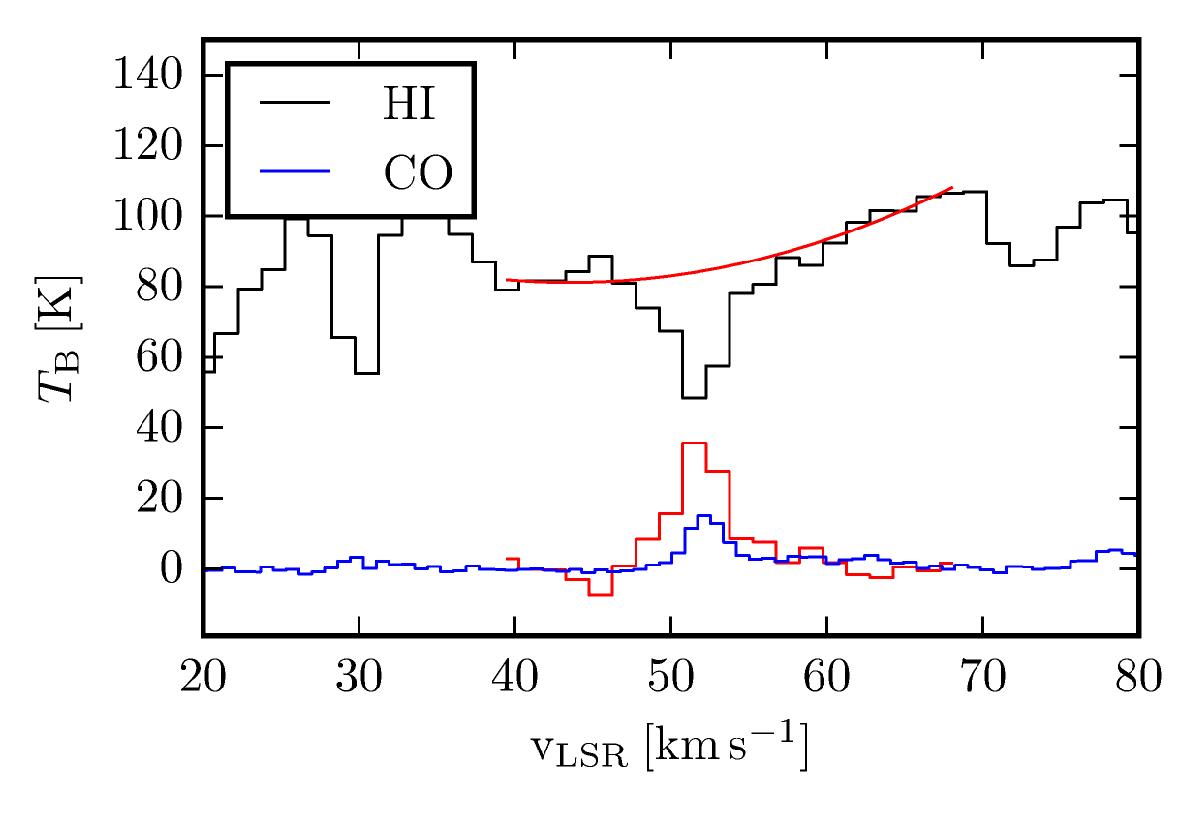
HI self-absorption spectrum at the position of l = 36.48 deg, b = −0.04. The spectrum is extracted from the THOR+VGPS data at 40′′ resolution. The black spectrum shows the original data with a red second-order polynom fit to the environmental gas. The red spectrum is then the resulting HISA feature used to determine the column density (Bihr et al., in prep.). The blue spectrum is the corresponding 13CO(1–0) emission from the GRS survey (Jackson et al. 2006).
Current usage metrics show cumulative count of Article Views (full-text article views including HTML views, PDF and ePub downloads, according to the available data) and Abstracts Views on Vision4Press platform.
Data correspond to usage on the plateform after 2015. The current usage metrics is available 48-96 hours after online publication and is updated daily on week days.
Initial download of the metrics may take a while.