Fig. 5
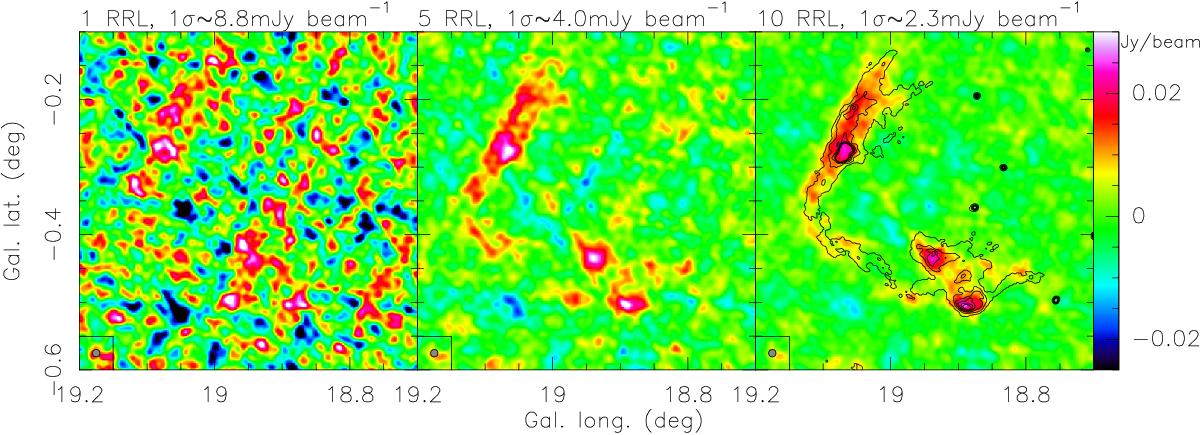
Example of recombination line stacking toward the Hii region G18.9-0.3. The images show one recombination line emission region for various numbers of stacked images in a single channel of 10 km s-1 width (around 70 km s-1). The left panel represents a single recombination line (H152α), the middle contains 5 RRLs, and the right panel combines 10 RRLs. The synthesized beam of 40′′ is shown in the bottom left corner of each panel. For reference, the contours in the right panel present the corresponding 1.4 GHz continuum data (see also Fig. 8) with contour levels from 50 to 150 K in steps of 20 K.
Current usage metrics show cumulative count of Article Views (full-text article views including HTML views, PDF and ePub downloads, according to the available data) and Abstracts Views on Vision4Press platform.
Data correspond to usage on the plateform after 2015. The current usage metrics is available 48-96 hours after online publication and is updated daily on week days.
Initial download of the metrics may take a while.