Fig. 4
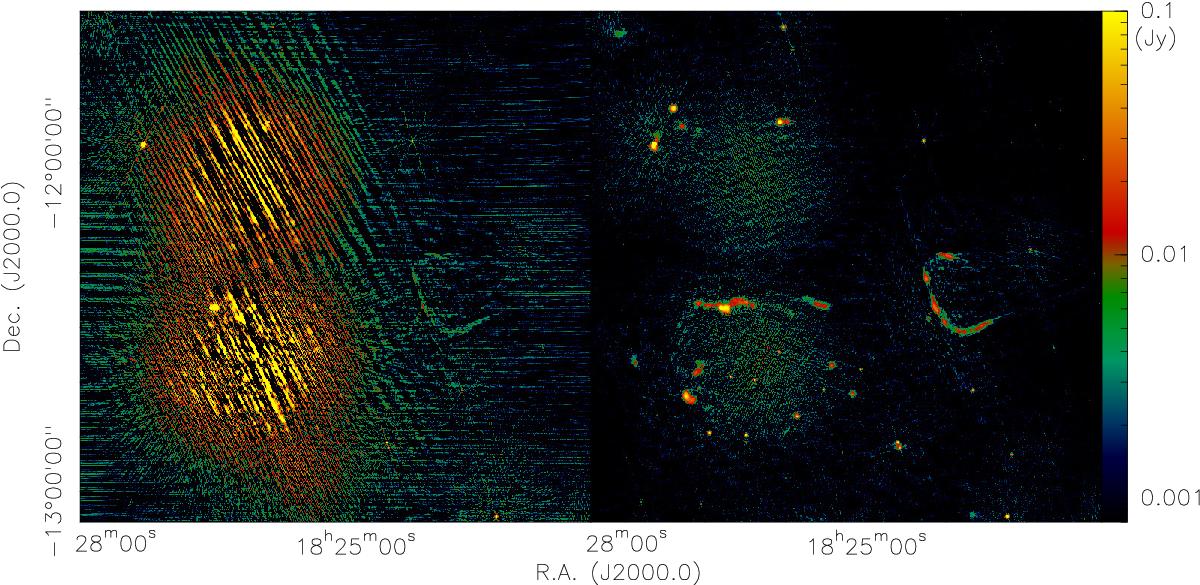
Example of image affected by RFI in the continuum band cont8 around 1948 MHz. The left and right panels show data around Galactic longitudes of 18 deg before and after RFI flagging. The stripy features in the left panel show the strong RFI contribution, which is largely (but not entirely) removed after the automatic RFI flagging in the right panel. The color scale is chosen to also show the remaining artifacts.
Current usage metrics show cumulative count of Article Views (full-text article views including HTML views, PDF and ePub downloads, according to the available data) and Abstracts Views on Vision4Press platform.
Data correspond to usage on the plateform after 2015. The current usage metrics is available 48-96 hours after online publication and is updated daily on week days.
Initial download of the metrics may take a while.