Free Access
Fig. A.2
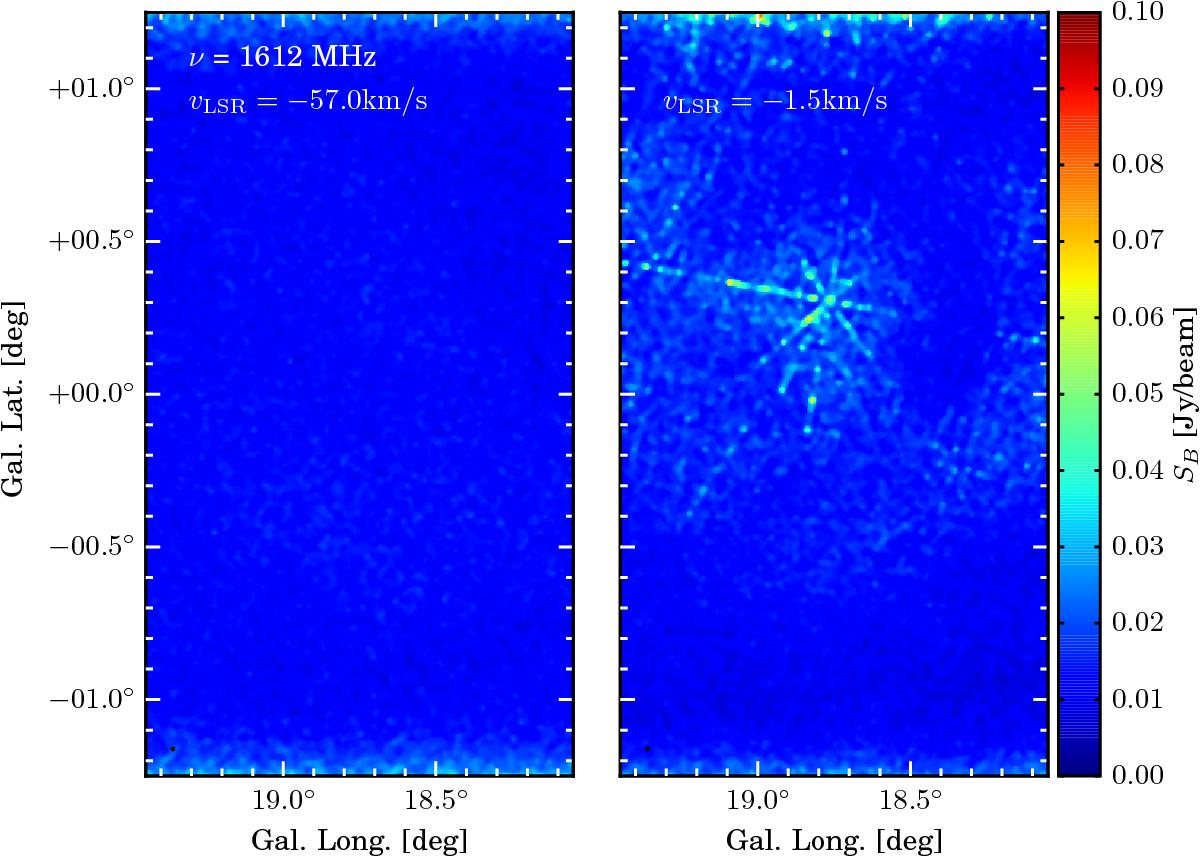
Example noise maps in the l 18 to 19 deg field for OH at 1612 MHz. The left panel shows an empty channel, while the right panel shows an example for a channel with a strong maser peak. The scale bars for all wavelengths are the same.
Current usage metrics show cumulative count of Article Views (full-text article views including HTML views, PDF and ePub downloads, according to the available data) and Abstracts Views on Vision4Press platform.
Data correspond to usage on the plateform after 2015. The current usage metrics is available 48-96 hours after online publication and is updated daily on week days.
Initial download of the metrics may take a while.