Free Access
Fig. A.1
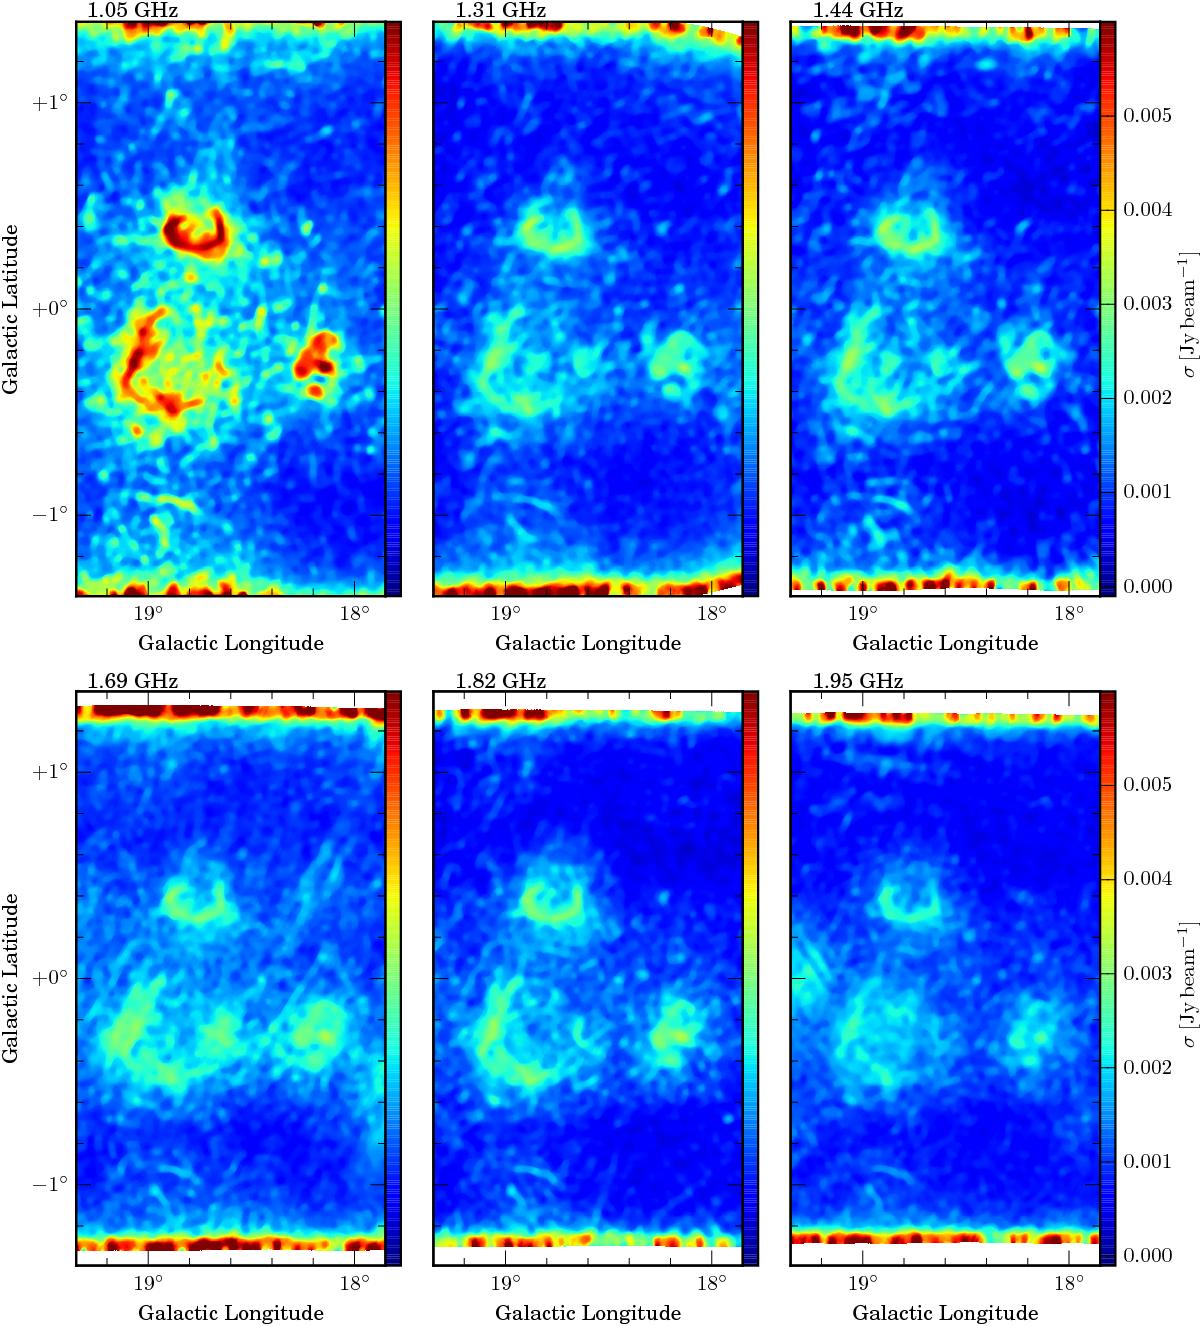
Example continuum noise maps in the l 18 to 19 deg field. The scale bars for all wavelengths are the same. The frequencies increase from the top left to the bottom right corner. The noise level clearly depends on the source structure and the different bands.
Current usage metrics show cumulative count of Article Views (full-text article views including HTML views, PDF and ePub downloads, according to the available data) and Abstracts Views on Vision4Press platform.
Data correspond to usage on the plateform after 2015. The current usage metrics is available 48-96 hours after online publication and is updated daily on week days.
Initial download of the metrics may take a while.