Fig. 15
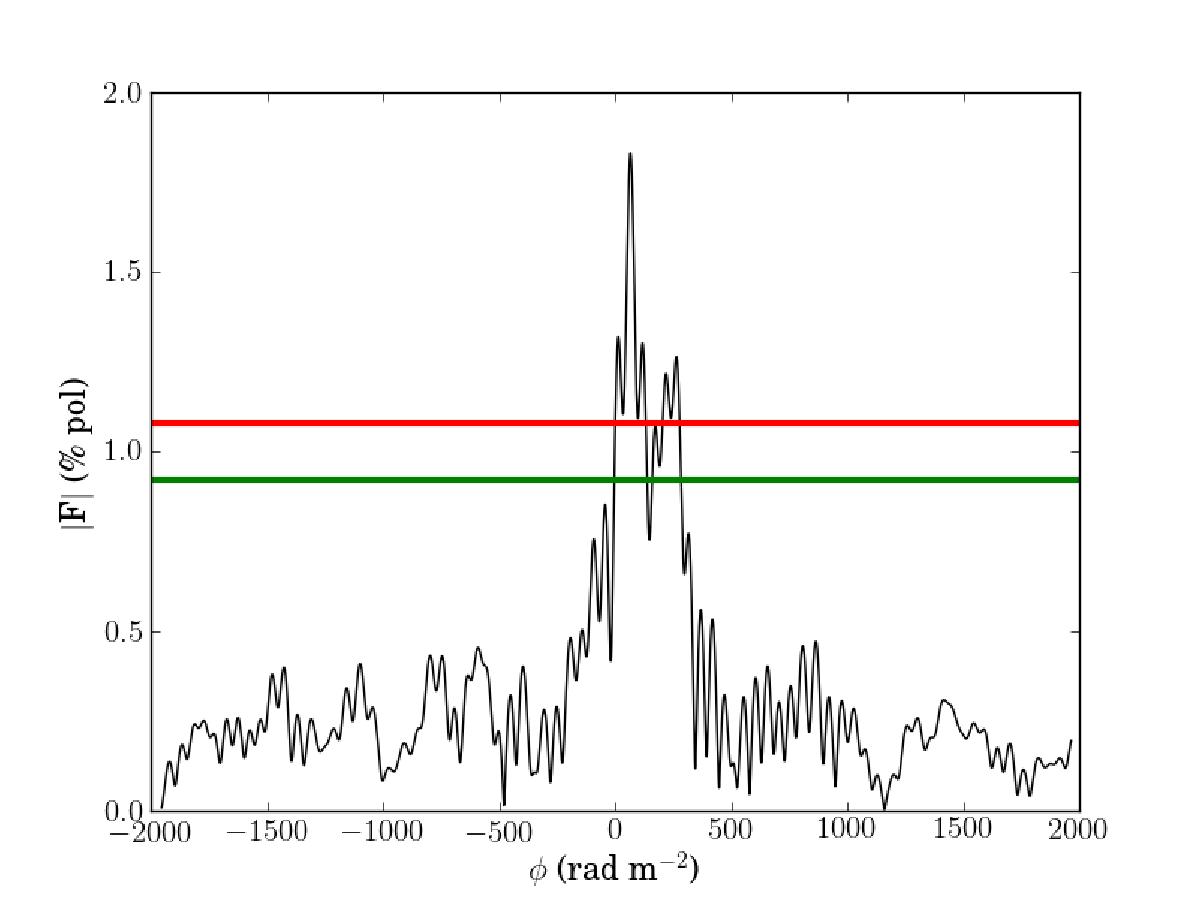
Integrated Faraday depth spectrum of the pulsar wind nebula at the center of the SNR Kes75 (l = 29.7104° and b = −0.2402°). The vertical axis represents the degree of polarization as a percentage of the total flux density, after unwrapping Faraday rotation assuming Faraday depth φ and averaging over the observed frequency range. The green and red lines indicate the maximum over all Faraday depths of 100 and 300 realizations of the analysis, respectively, which replace the Q and U spectra of the target by noise spectra from off-source positions, integrated over the same solid angle as the target. We detect components at Faraday depth φ1 = 60 rad m-2 and Faraday depth φ2 = 258 rad m-2. The formal error in Faraday depth is ~5 rad m-2 for a 10σ detection.
Current usage metrics show cumulative count of Article Views (full-text article views including HTML views, PDF and ePub downloads, according to the available data) and Abstracts Views on Vision4Press platform.
Data correspond to usage on the plateform after 2015. The current usage metrics is available 48-96 hours after online publication and is updated daily on week days.
Initial download of the metrics may take a while.