Fig. 13
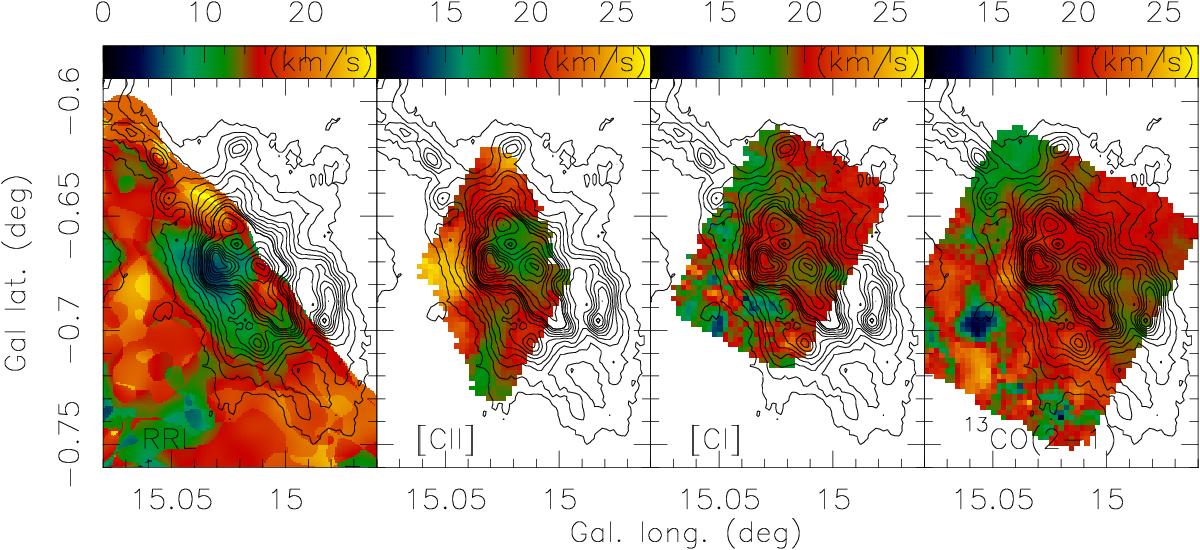
Compilation of first moment maps (intensity-weighted peak velocities) toward M17 of the THOR RRL data (left panel) with ionized carbon, atomic carbon, and molecular carbon (second to fourth panels) taken from Pérez-Beaupuits et al. (2012, 2015). The color scale for the recombination lines is from 0 to 27 km s-1, for the others from 11 to 27 km s-1. The contours show the 870 μm continuum data from the ATLASGAL survey starting at a 4σ level of 200 mJy beam-1.
Current usage metrics show cumulative count of Article Views (full-text article views including HTML views, PDF and ePub downloads, according to the available data) and Abstracts Views on Vision4Press platform.
Data correspond to usage on the plateform after 2015. The current usage metrics is available 48-96 hours after online publication and is updated daily on week days.
Initial download of the metrics may take a while.