Fig. 12
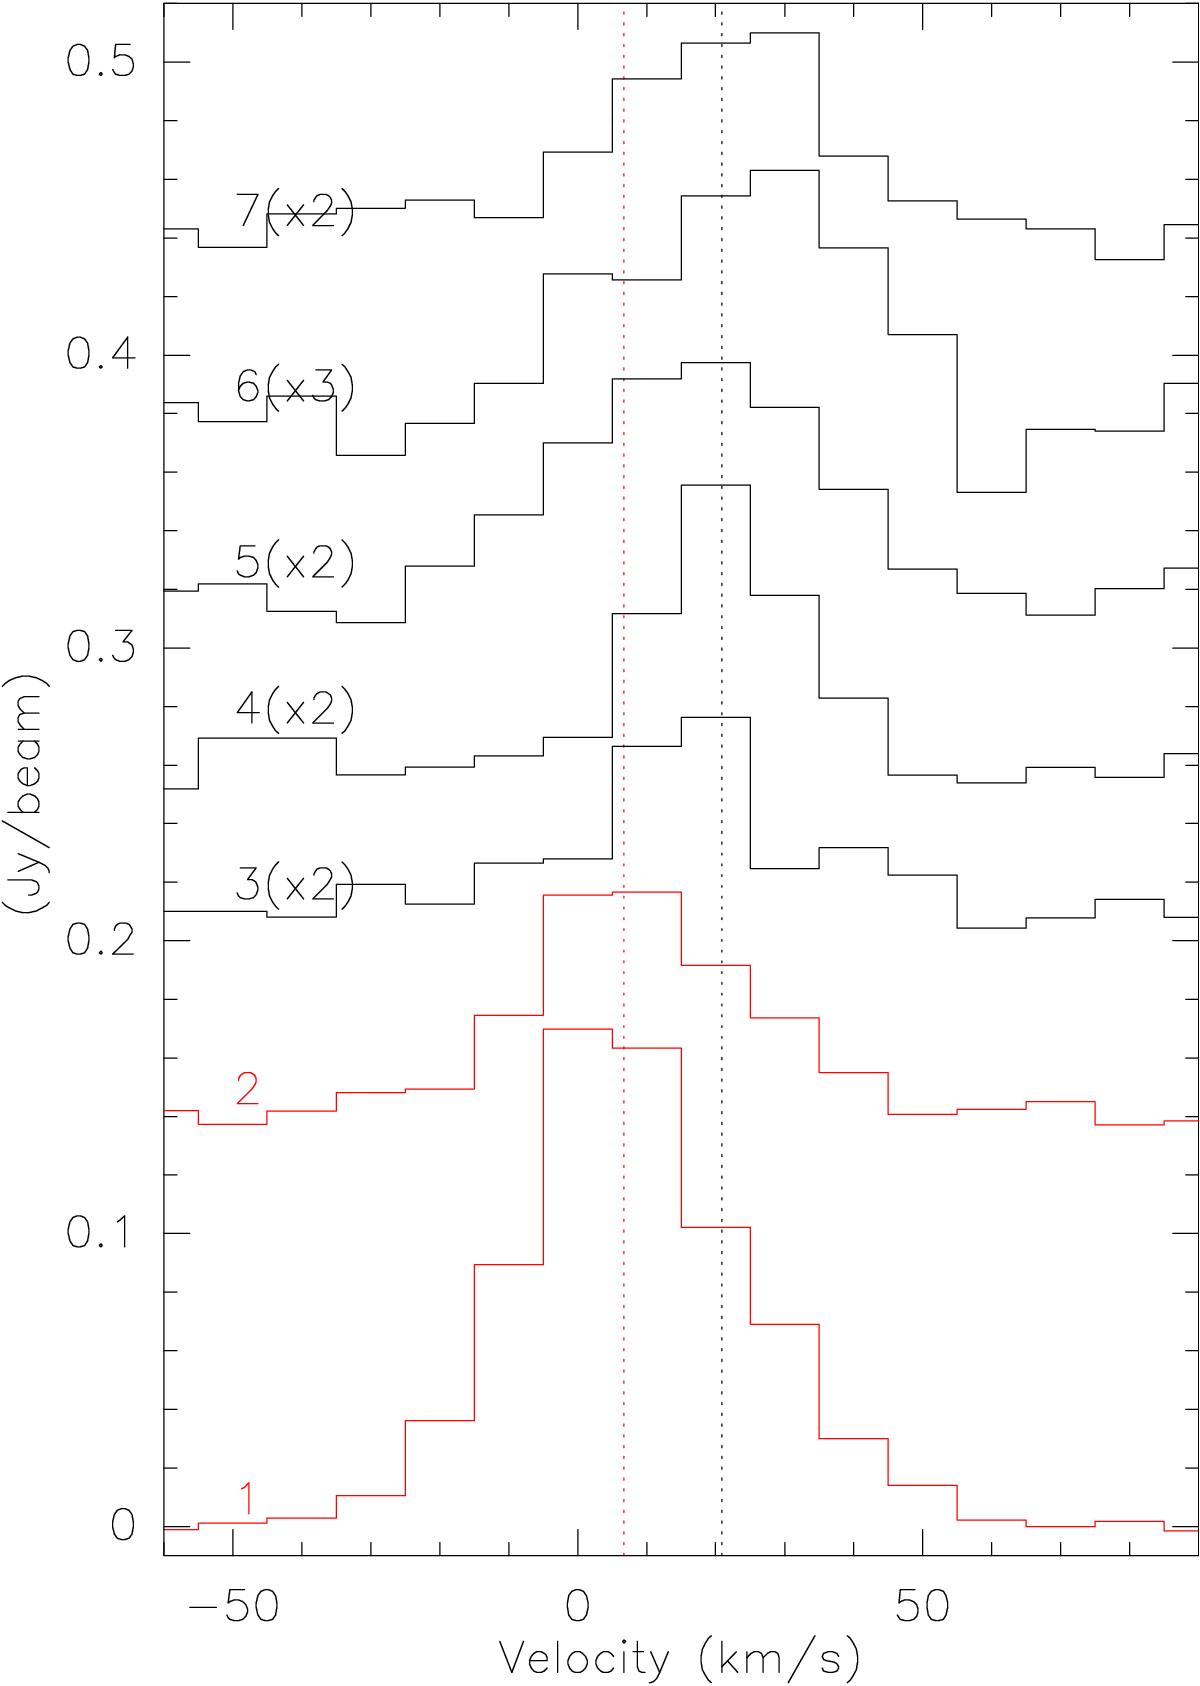
Stacked RRL spectra toward the seven positions marked in Fig. 11. The identifying number is followed (in parentheses) by the factor by which these have been multiplied. The red lowest two spectra are extracted toward two intensity maxima, while the remaining black spectra are extracted from environmental positions of the Hii region. The dotted red and black lines mark the peak velocities of Gaussian fits to spectra 1 and 4, respectively.
Current usage metrics show cumulative count of Article Views (full-text article views including HTML views, PDF and ePub downloads, according to the available data) and Abstracts Views on Vision4Press platform.
Data correspond to usage on the plateform after 2015. The current usage metrics is available 48-96 hours after online publication and is updated daily on week days.
Initial download of the metrics may take a while.