Fig. 11
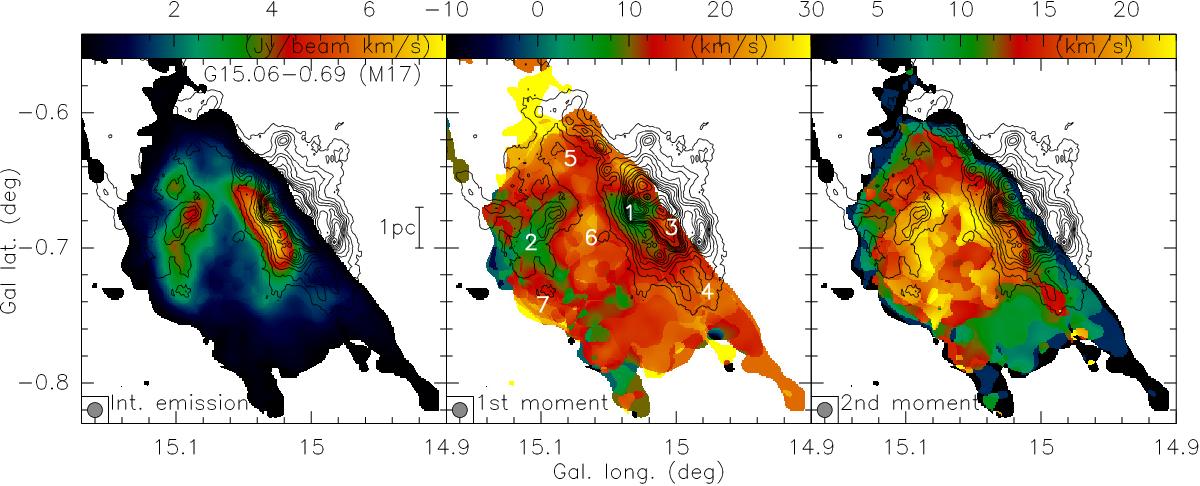
Stacked RRL images of G15.1 (also known as M17). The left, middle, and right panels present the zeroth-, first-, and second-moment maps (integrated emission, intensity-weighted peak velocity, and intensity-weighted line width) for the velocity range [−40, 50] km s-1, respectively. The beam size of 40′′ is shown in the bottom left corner of each panel. The contours show the 870 μm continuum data from the ATLASGAL survey starting at a 4σ level of 200 mJy beam-1. The left panel gives a linear scale-bar, and the middle panel includes numbers indicating the positions of the extracted spectra presented in Fig. 12.
Current usage metrics show cumulative count of Article Views (full-text article views including HTML views, PDF and ePub downloads, according to the available data) and Abstracts Views on Vision4Press platform.
Data correspond to usage on the plateform after 2015. The current usage metrics is available 48-96 hours after online publication and is updated daily on week days.
Initial download of the metrics may take a while.