Fig. 2
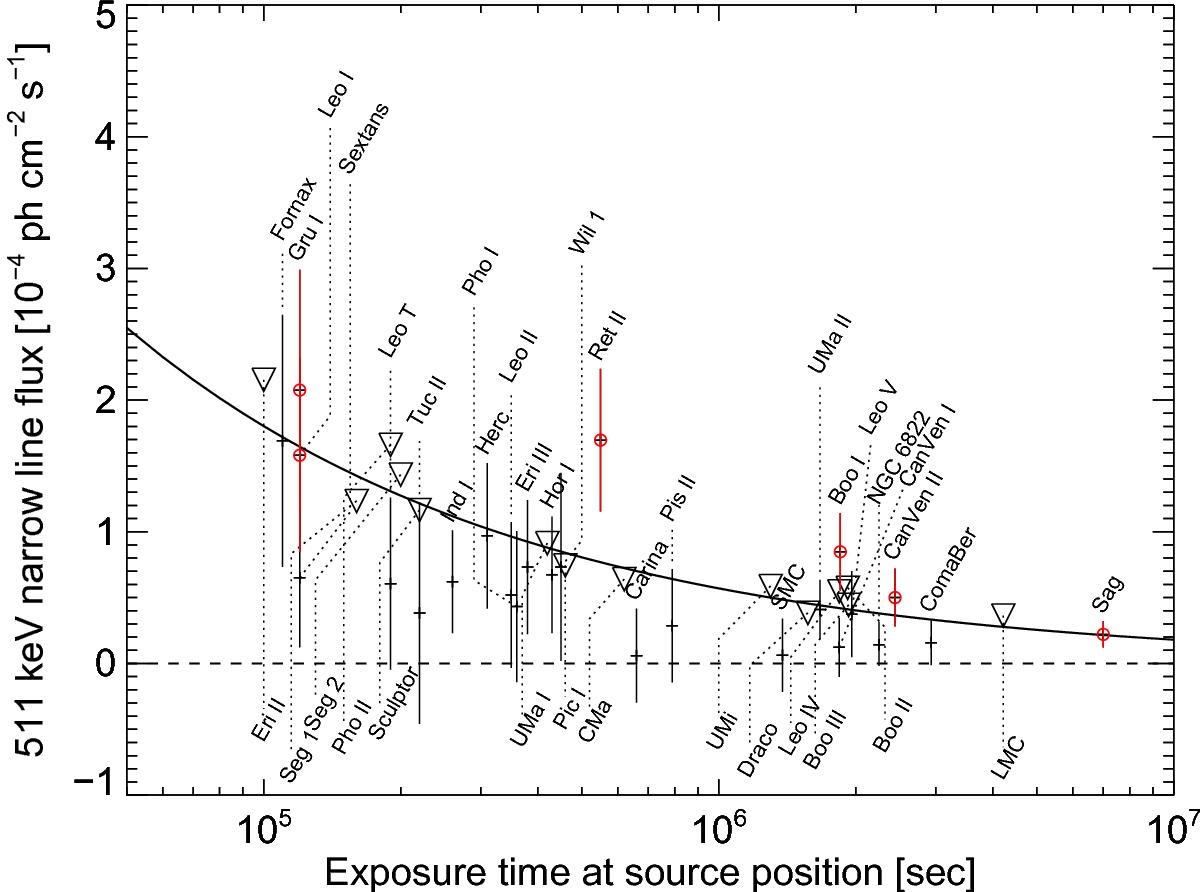
Derived fluxes (crosses) of each satellite galaxy against the exposure time at source position. If a line is not detected or appears negative, a 2σ upper limit is given (triangle). The solid line represents the 2σ sensitivity limit for a narrow line (instrumental resolution) seen with SPI at 511 keV. The (red) circles indicate sources for which the statistical significance is higher than 2σ.
Current usage metrics show cumulative count of Article Views (full-text article views including HTML views, PDF and ePub downloads, according to the available data) and Abstracts Views on Vision4Press platform.
Data correspond to usage on the plateform after 2015. The current usage metrics is available 48-96 hours after online publication and is updated daily on week days.
Initial download of the metrics may take a while.