Free Access
Fig. 4
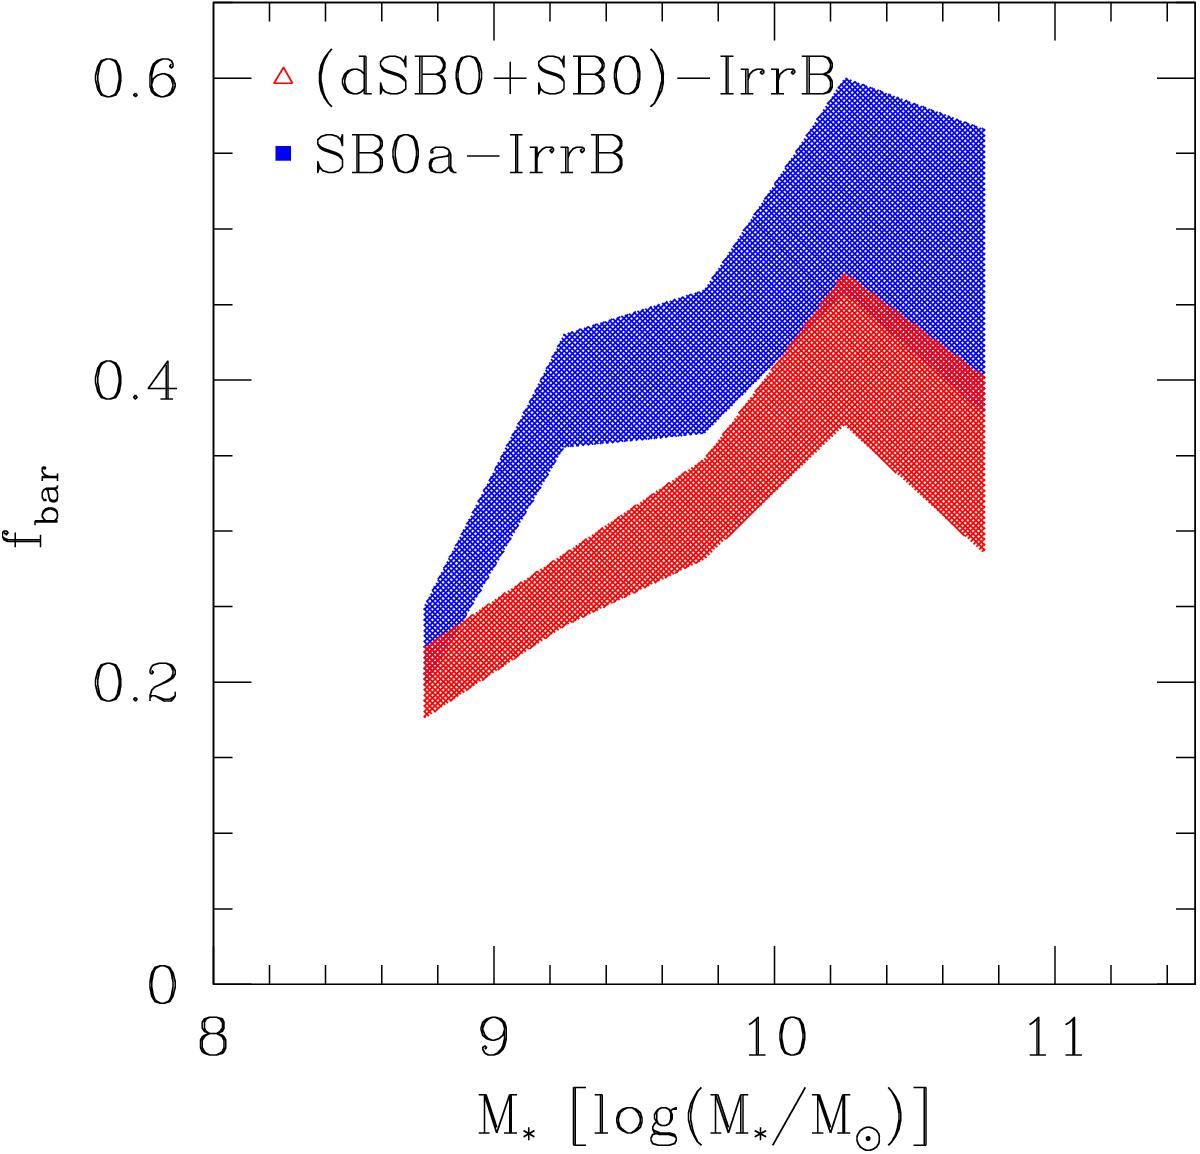
Optical local bar fraction as a function of stellar mass given separately for the sample that includes galaxies from S0a to Irr (blue) and the sample that accounts for SB0s (red). The width of the shaded area gives the poisson uncertainty in each bin.
Current usage metrics show cumulative count of Article Views (full-text article views including HTML views, PDF and ePub downloads, according to the available data) and Abstracts Views on Vision4Press platform.
Data correspond to usage on the plateform after 2015. The current usage metrics is available 48-96 hours after online publication and is updated daily on week days.
Initial download of the metrics may take a while.