Free Access
Fig. 21
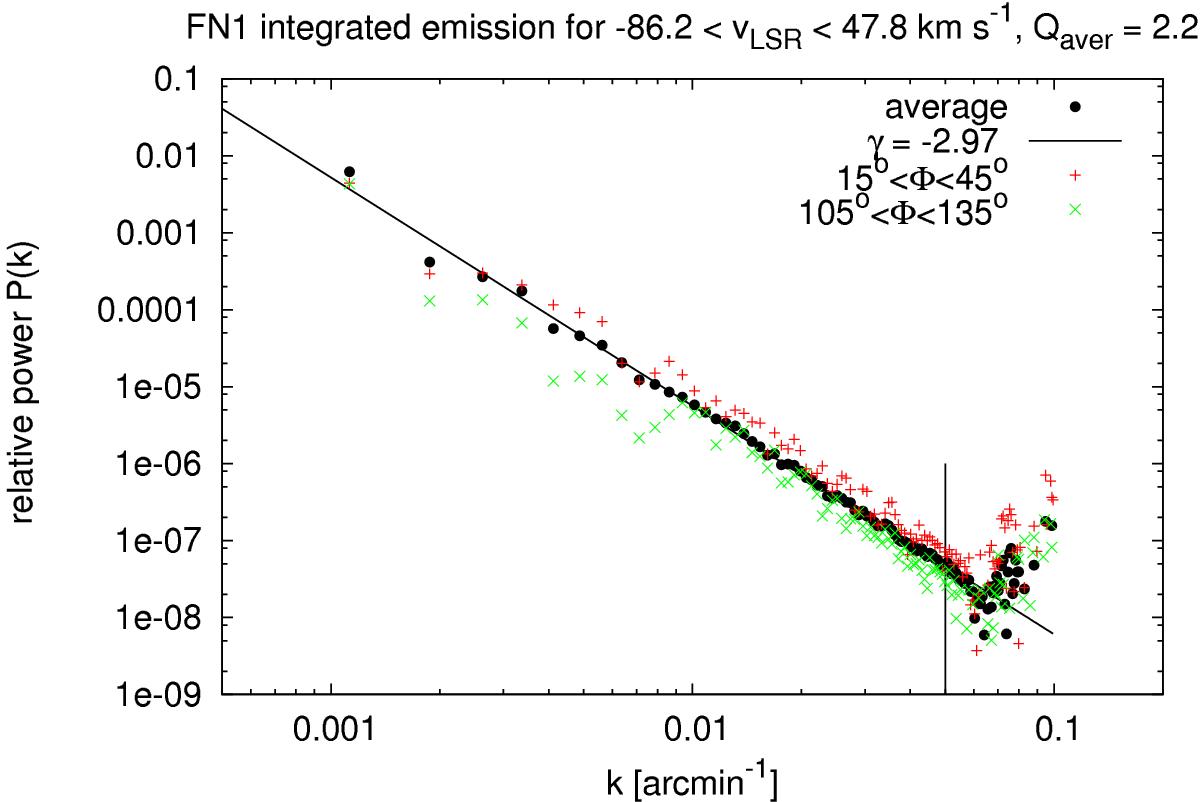
Average power spectrum for the integrated emission and fit power law (black) with γ = −3.00 ± 0.03 for k< 0.05 arcmin-1 (vertical line). In addition the power spectrum for 30° < Φ < 60° (red) and 120° < Φ < 150° (green) is given. The average anisotropy factor is Qaver = 2.0.
Current usage metrics show cumulative count of Article Views (full-text article views including HTML views, PDF and ePub downloads, according to the available data) and Abstracts Views on Vision4Press platform.
Data correspond to usage on the plateform after 2015. The current usage metrics is available 48-96 hours after online publication and is updated daily on week days.
Initial download of the metrics may take a while.