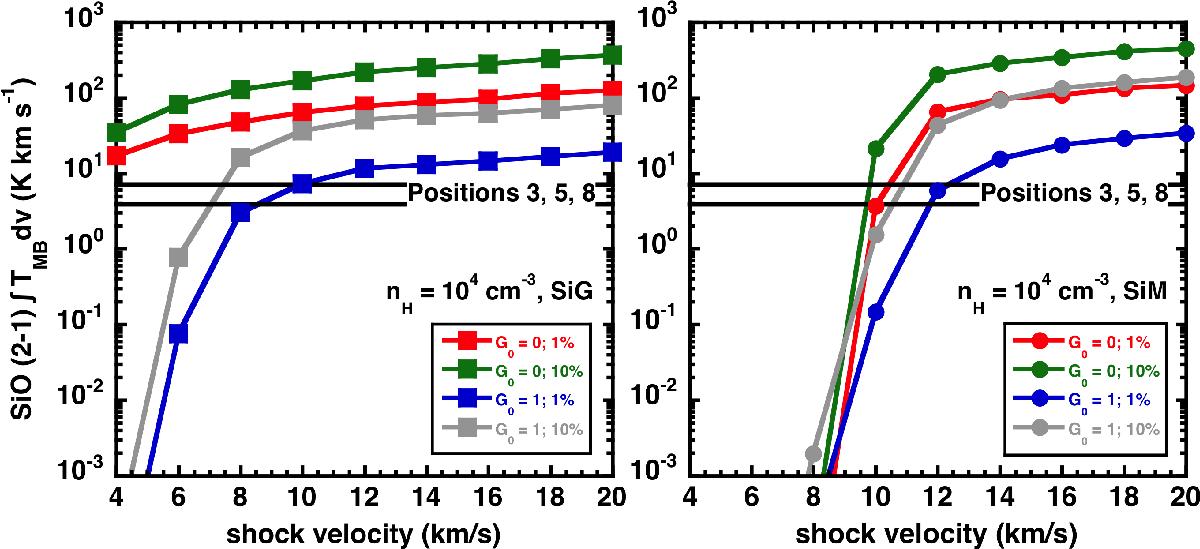
Fig. 8
Integrated intensity of the SiO(2−1) transition against the shock velocity calculated over the nH = 104 cm-3 fragment of our grid of models (colored symbols), and compared to the observations (thick, horizontal black line, obtained in position 1, with thinner lines corresponding to ± 15% uncertainty; see Tables 7 and 8). The left and right panels correspond to the SiG (square symbols) and SiM (circle symbols) scenarios (see text). The color code is indicated in the panels, where the G0 (=0 or 1) value and fraction of preshock free silicon (=1 or 10%) is shown for each model.
Current usage metrics show cumulative count of Article Views (full-text article views including HTML views, PDF and ePub downloads, according to the available data) and Abstracts Views on Vision4Press platform.
Data correspond to usage on the plateform after 2015. The current usage metrics is available 48-96 hours after online publication and is updated daily on week days.
Initial download of the metrics may take a while.