Free Access
Fig. 5
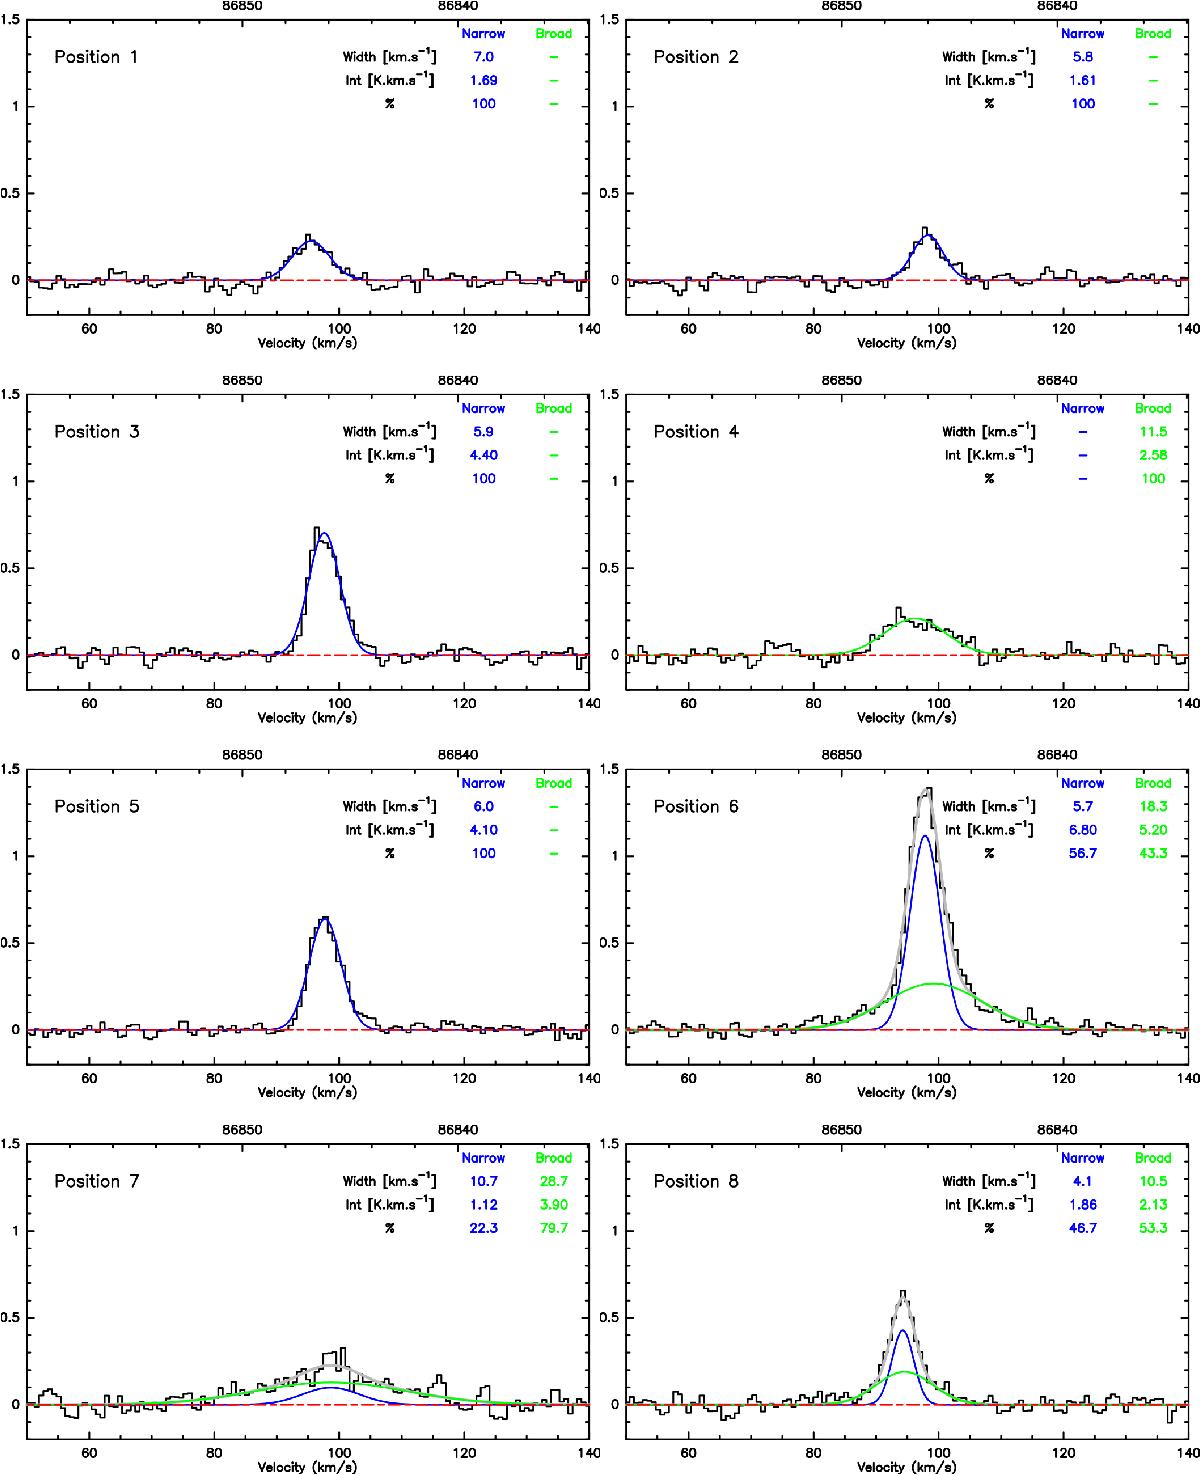
SiO(2−1) molecular lines, averaged for the eight areas shown in Fig. 1c with white circles. These lines are fitted by the sum of narrow (blue curve) and broad (green curve) Gaussian components shown by the gray curve. The red dashed line shows the zero level baseline.
Current usage metrics show cumulative count of Article Views (full-text article views including HTML views, PDF and ePub downloads, according to the available data) and Abstracts Views on Vision4Press platform.
Data correspond to usage on the plateform after 2015. The current usage metrics is available 48-96 hours after online publication and is updated daily on week days.
Initial download of the metrics may take a while.