Free Access
Fig. 4
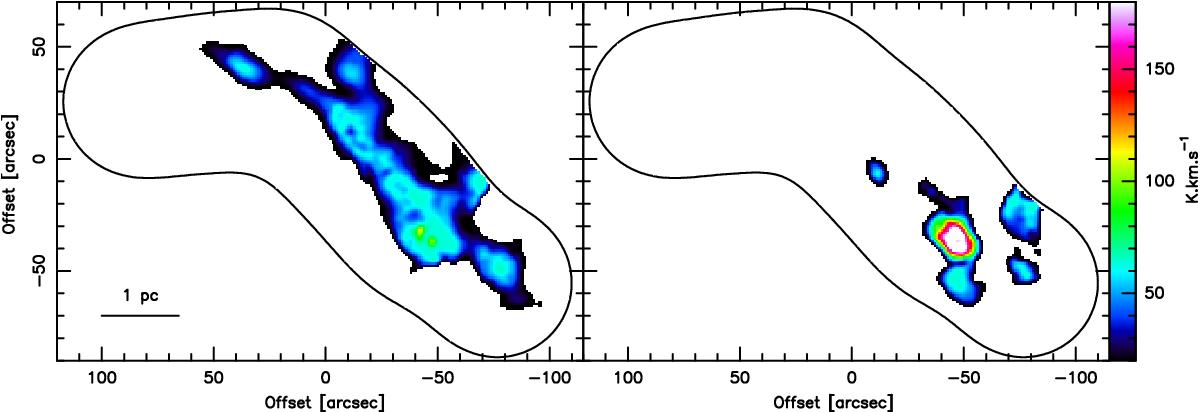
Spatial distribution of the narrow (left panel, <12 km s-1) and wide (right panel, >12 km s-1) components fitted to the SiO lines of the W43-MM1 ridge, shown from the integrated fluxes of Gaussian fits of these two components. The back contour highlights the area covered by the IRAM PdBI observations.
Current usage metrics show cumulative count of Article Views (full-text article views including HTML views, PDF and ePub downloads, according to the available data) and Abstracts Views on Vision4Press platform.
Data correspond to usage on the plateform after 2015. The current usage metrics is available 48-96 hours after online publication and is updated daily on week days.
Initial download of the metrics may take a while.