Fig. 2
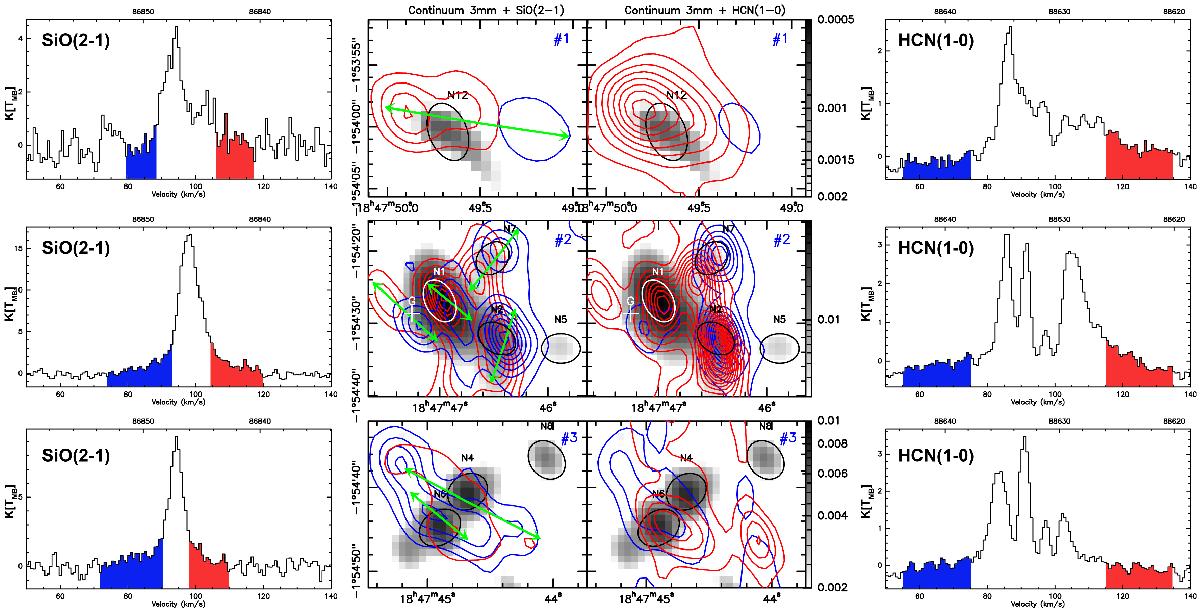
Seven outflows found in the W43-MM1 ridge through SiO(2−1) and HCN(1−0) line wing integration. The top, middle, and bottom rows correspond to #1, #2, and #3 boxes shown in Fig. 1c. The left panels show the mean SiO(2−1) emission line profiles in the areas corresponding to box #1, #2, and #3, respectively. The right panels show the mean HCN(1−0) emission line profiles in the areas corresponding to box #1, #2, and #3, respectively. In the SiO(2−1) and HCN(1−0) spectra, the channels filled with blue and red correspond to the velocity ranges used to define the blue wing and red wing, respectively. The middle panels show the 3 mm continuum emission overlaid with SiO(2−1) contours on right panels and HCN(1−0) contours on left panels. The blue contours correspond to the blue line wings and the red contours correspond to red line wings. All contours start at 2σ with 2σ steps. The black and white ellipses highlight MDCs extracted from the interferometric continuum maps at 3 mm presented in Louvet et al. (2014), and the white cross on the middle panel locates source G of Sridharan et al. (2014). Green arrows indicate outflow directions.
Current usage metrics show cumulative count of Article Views (full-text article views including HTML views, PDF and ePub downloads, according to the available data) and Abstracts Views on Vision4Press platform.
Data correspond to usage on the plateform after 2015. The current usage metrics is available 48-96 hours after online publication and is updated daily on week days.
Initial download of the metrics may take a while.