Fig. 1
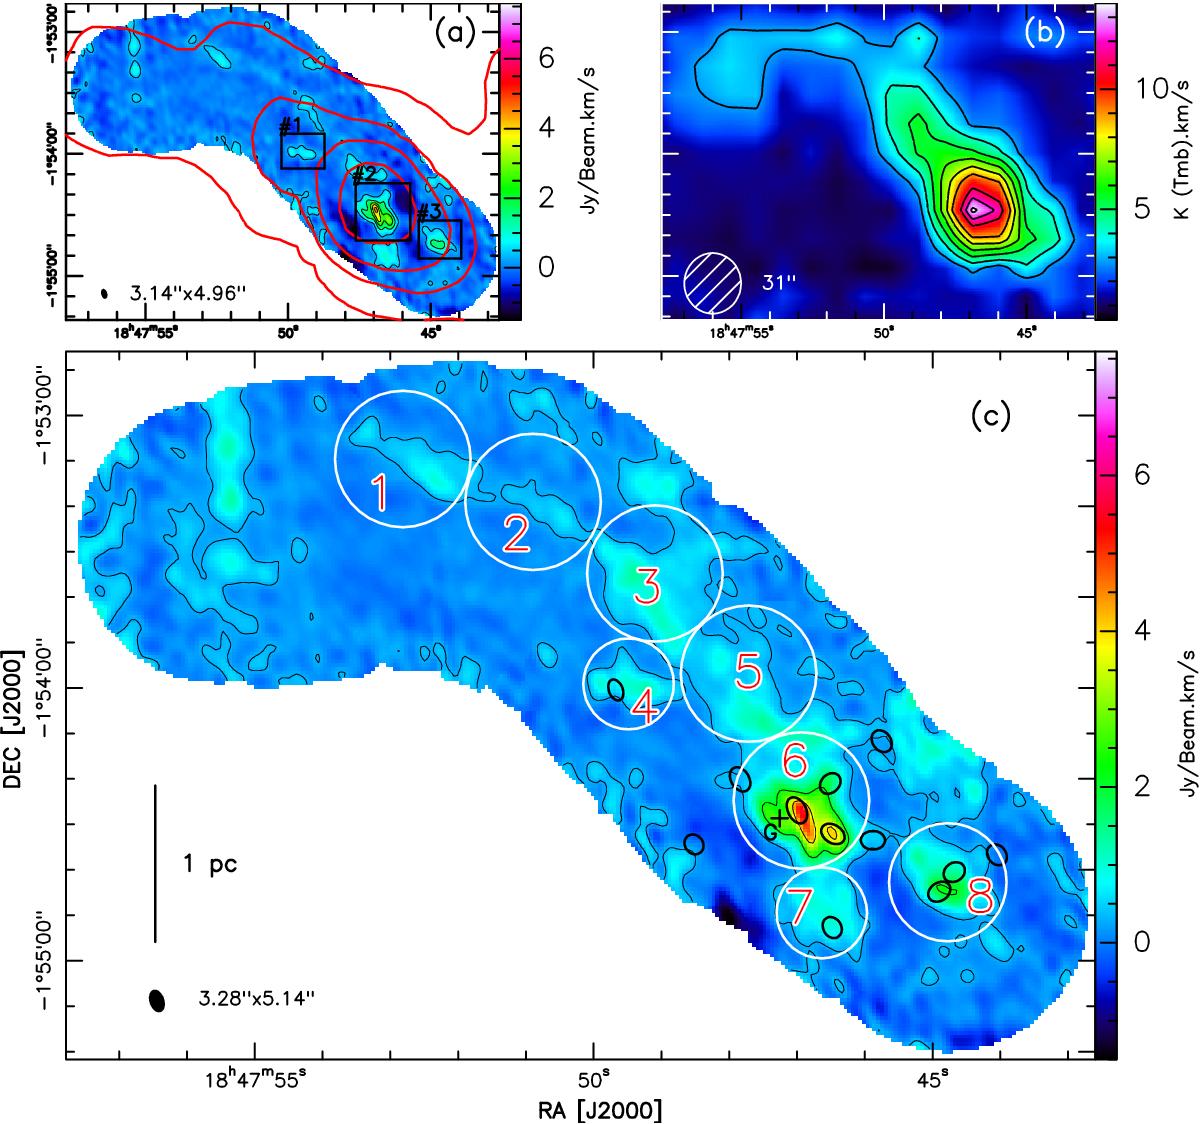
Extended SiO emission toward the W43-MM1 ridge. SiO(2−1) maps, integrated from 80 km s-1 to 120 km s-1, were obtained with the IRAM PdBI a), IRAM 30 m b), and from the merging of both data sets c). Panel a): black contours start at 1.9 Jy/beam km s-1 with 0.95 Jy/beam km s-1 steps. Red contours correspond to the Herschel column density map (see Nguyen Luong et al. 2013; Louvet et al. 2014). The contours, going towards the inner parts, are 5 × 1022 cm-2, 1023 cm-2, 1.8 × 1023 cm-2, and 3.5 × 1023 cm-2. Black rectangles, labeled #1, #2, and #3, indicate the areas where zooms are shown in Fig. 2. Panel b): from Nguyen Luong et al. (2011); black contours start at 2.8 K km s-1 with 1.2 K km s-1 steps. Panel c): the black contours start at 0.3 Jy/beam km s-1 with 1.8 Jy/beam km s-1 steps. Black ellipses highlight MDCs extracted from the interferometric continuum maps presented in Louvet et al. (2014) and the black cross indicates an extra source, named G, presented by Sridharan et al. (2014). White circles numbered from 1 to 8 indicate the positions of the integrated SiO(2−1) emission spectra presented in Fig. 5.
Current usage metrics show cumulative count of Article Views (full-text article views including HTML views, PDF and ePub downloads, according to the available data) and Abstracts Views on Vision4Press platform.
Data correspond to usage on the plateform after 2015. The current usage metrics is available 48-96 hours after online publication and is updated daily on week days.
Initial download of the metrics may take a while.