Fig. 9
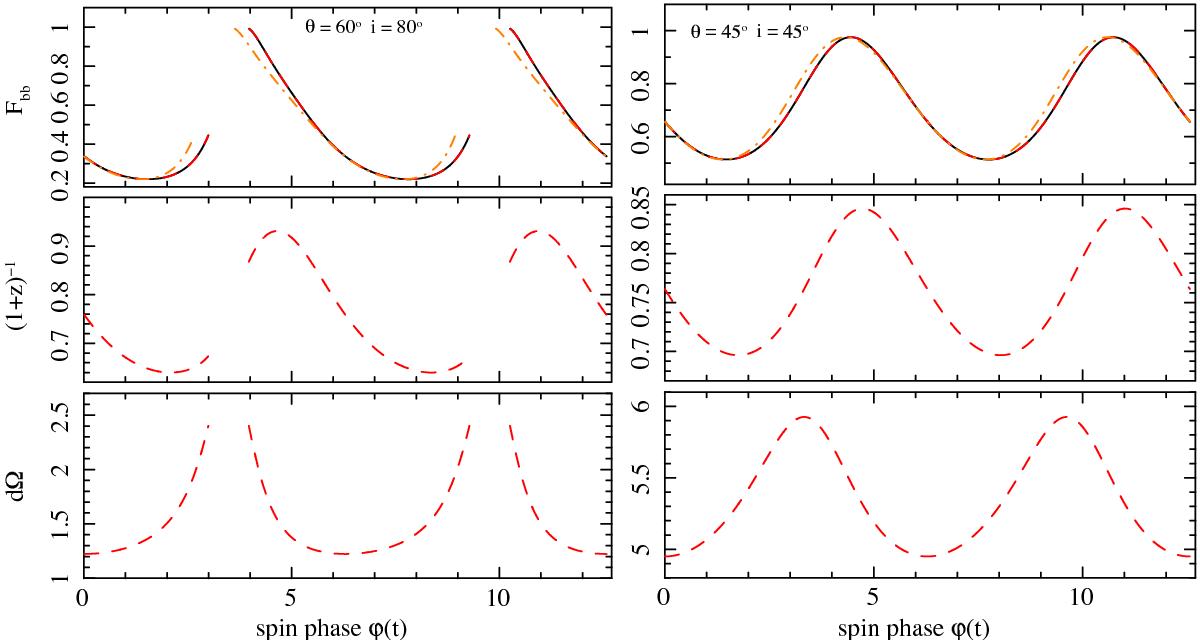
Modulation from a hot spot on an NS as a function of rotational phase for different inclination angles and hot spot colatitude. Light travel time delays are included. The continuous black lines represent the results from a numerical integration of the original equations; the dashed red lines are obtained from the polynomial approximate equations. The dashed-dotted orange line does not include light travel time delays.
Current usage metrics show cumulative count of Article Views (full-text article views including HTML views, PDF and ePub downloads, according to the available data) and Abstracts Views on Vision4Press platform.
Data correspond to usage on the plateform after 2015. The current usage metrics is available 48-96 hours after online publication and is updated daily on week days.
Initial download of the metrics may take a while.