Fig. 5
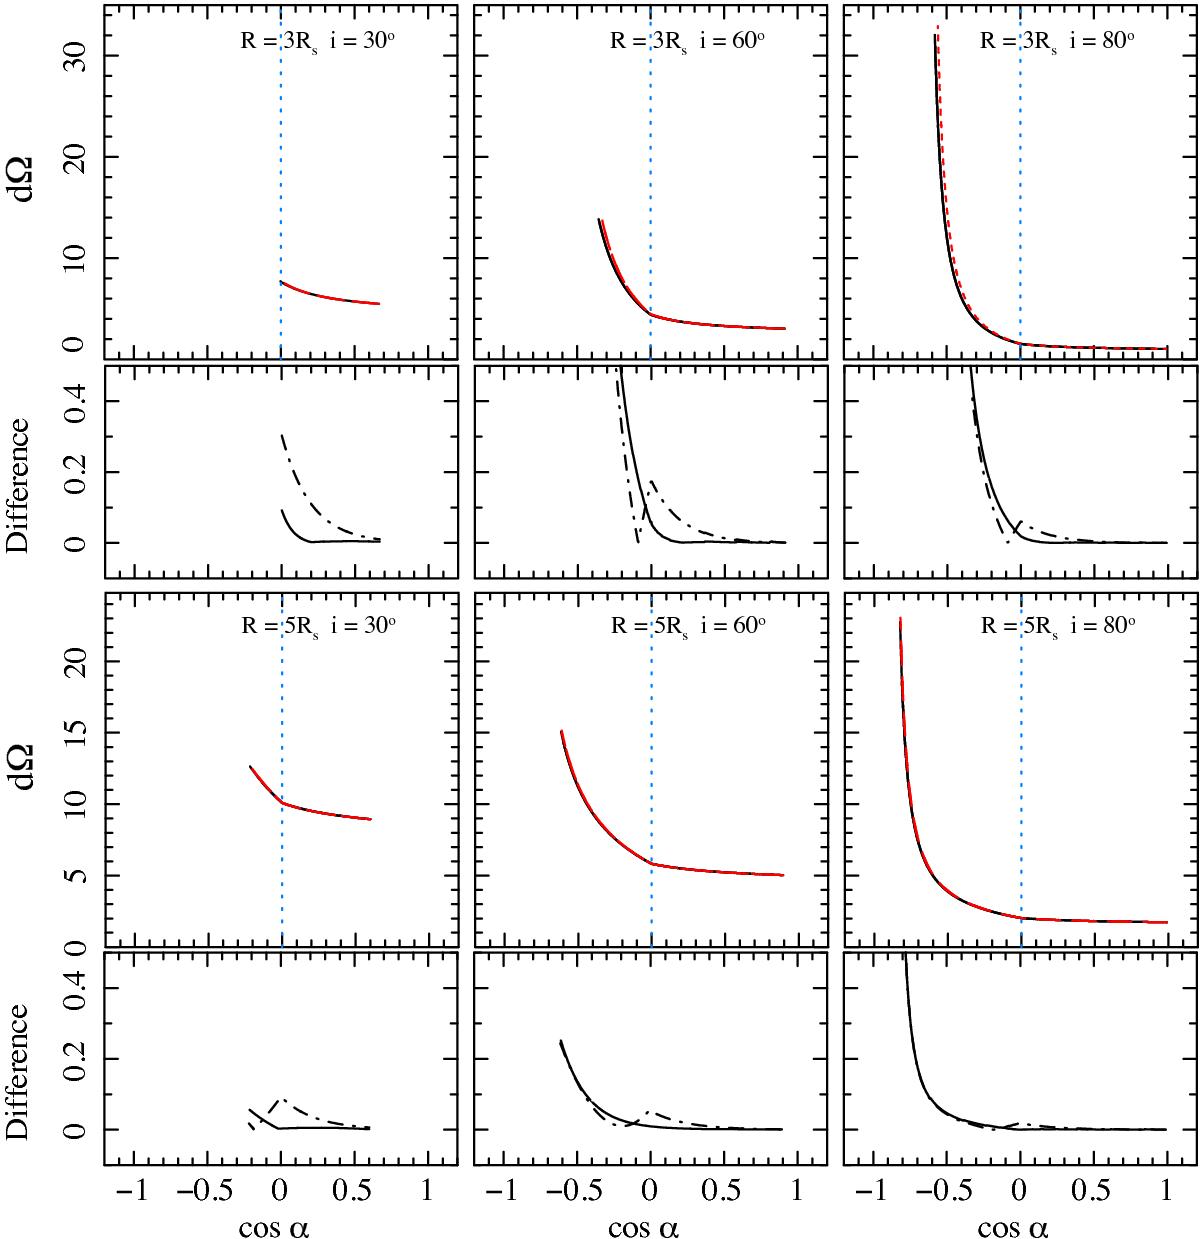
Continuous black curves are obtained from the original solid angle Eq. (9), while the dashed red curves are from the polynomial approximation in Eq. (30). Different panels are for R = 3rs and R = 5rs and three different inclination angles, i = 30°, i = 60°, and i = 80°. The dotted blue line helps distinguishing trajectories without a turning point (i.e., 0 ≤ cosα ≤ 1) from those with a turning point (i.e., π/ 2 ≤ α ≤ αmax). The lower panels show the difference between the curves from the original and approximate equations. The dotted-dashed lines represent the difference between the curves from the original and Beloborodov (2002) equations.
Current usage metrics show cumulative count of Article Views (full-text article views including HTML views, PDF and ePub downloads, according to the available data) and Abstracts Views on Vision4Press platform.
Data correspond to usage on the plateform after 2015. The current usage metrics is available 48-96 hours after online publication and is updated daily on week days.
Initial download of the metrics may take a while.