Fig. 9
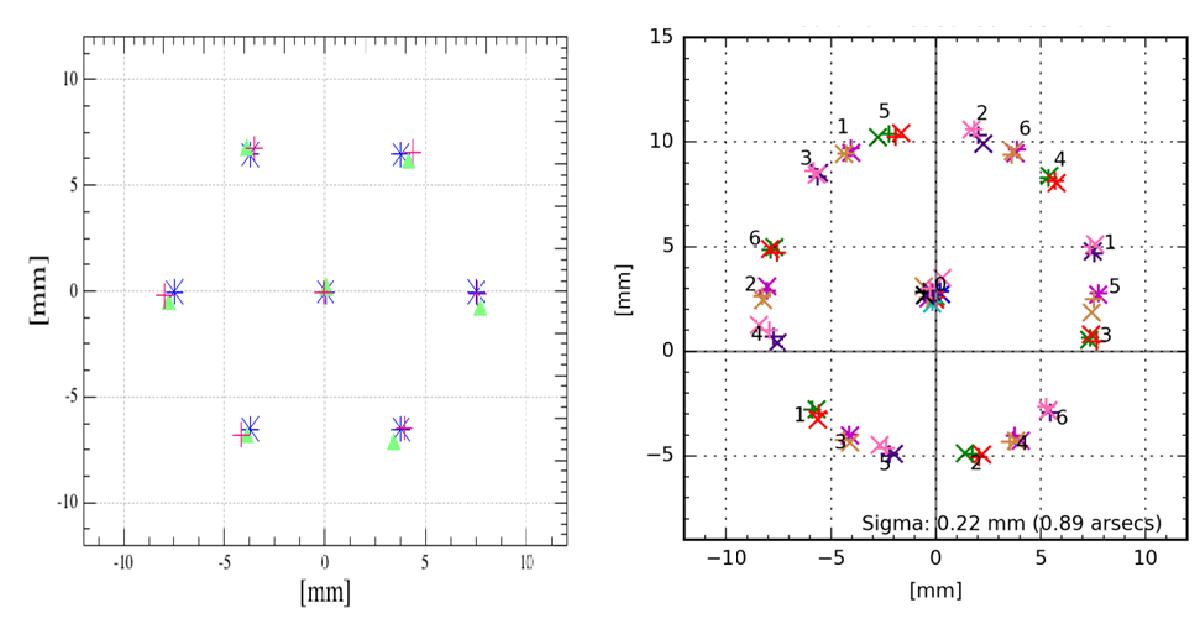
Derived focal plane pixel positions from laboratory measurements for both LFA sub-arrays (left plot) shown with green triangles and red crosses, compared to the nominal designed positions plotted as blue crosses. The right plot shows the on-sky derivation of the pixel positions, performed for different derotator angles. The subarray positions are plotted using a same color, for example red and green are the H and V polarizations subarrays at a given derotator angle, then the other colors are taken for different angles. The (0, 0) for the plot refers to the SOFIA optical axis, which is different to the mechanical derotator axis. The rms deviations of the individual pixel positions of ~0.22 mm around the nominal positions in an ideal hexagonal pattern, corresponds to 0.89′′on the sky.
Current usage metrics show cumulative count of Article Views (full-text article views including HTML views, PDF and ePub downloads, according to the available data) and Abstracts Views on Vision4Press platform.
Data correspond to usage on the plateform after 2015. The current usage metrics is available 48-96 hours after online publication and is updated daily on week days.
Initial download of the metrics may take a while.