Fig. 7
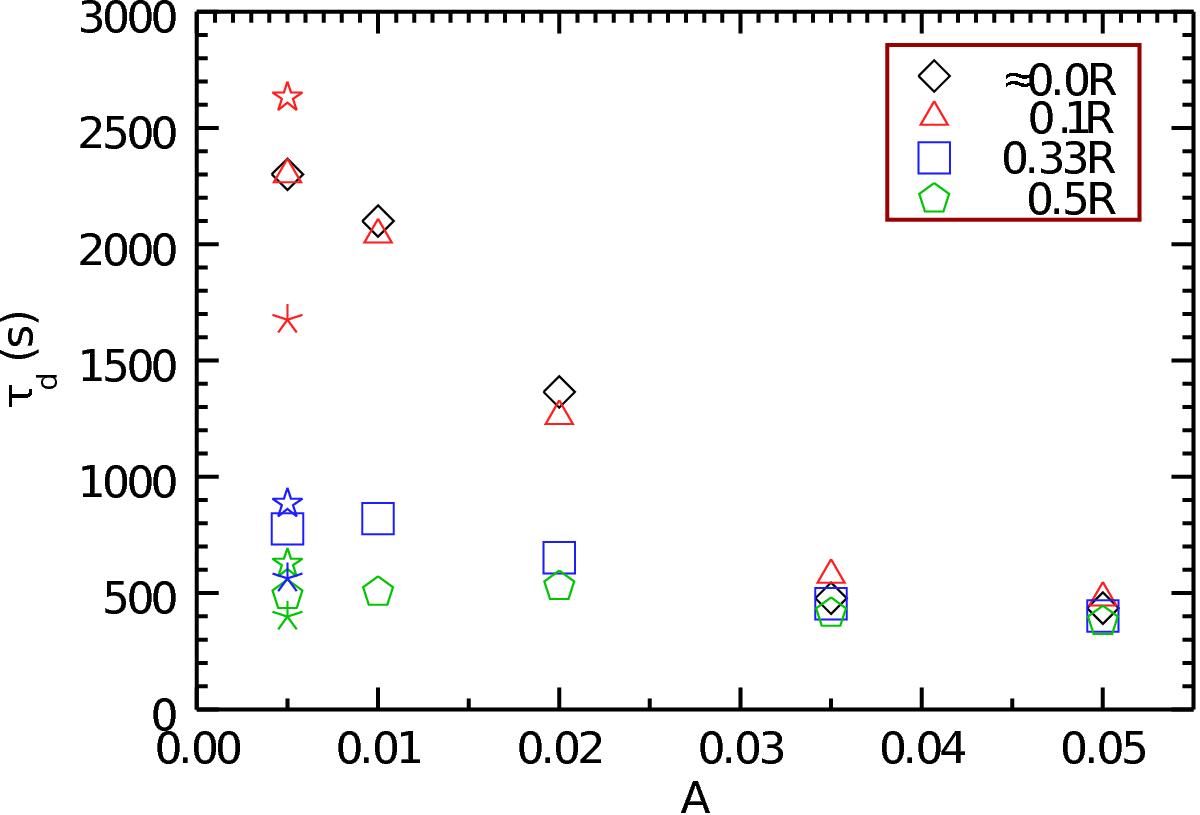
Exponential damping times for the different initial amplitudes, (A), and inhomogeneous layer widths, represented by diamond (⋄), triangle (△), square (□), and pentagon (![]() ), in increasing order. The stars (⋆) of the same colour as the symbols, represent the theoretically predicted damping time for the specific layer width and sinusoidal layer density profile. Analogously, the asterisks (E) represent the predicted damping for a linear layer density profile (Goossens et al. 2002).
), in increasing order. The stars (⋆) of the same colour as the symbols, represent the theoretically predicted damping time for the specific layer width and sinusoidal layer density profile. Analogously, the asterisks (E) represent the predicted damping for a linear layer density profile (Goossens et al. 2002).
Current usage metrics show cumulative count of Article Views (full-text article views including HTML views, PDF and ePub downloads, according to the available data) and Abstracts Views on Vision4Press platform.
Data correspond to usage on the plateform after 2015. The current usage metrics is available 48-96 hours after online publication and is updated daily on week days.
Initial download of the metrics may take a while.