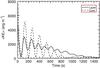
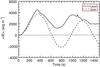
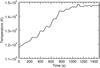
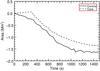
Fig. 4
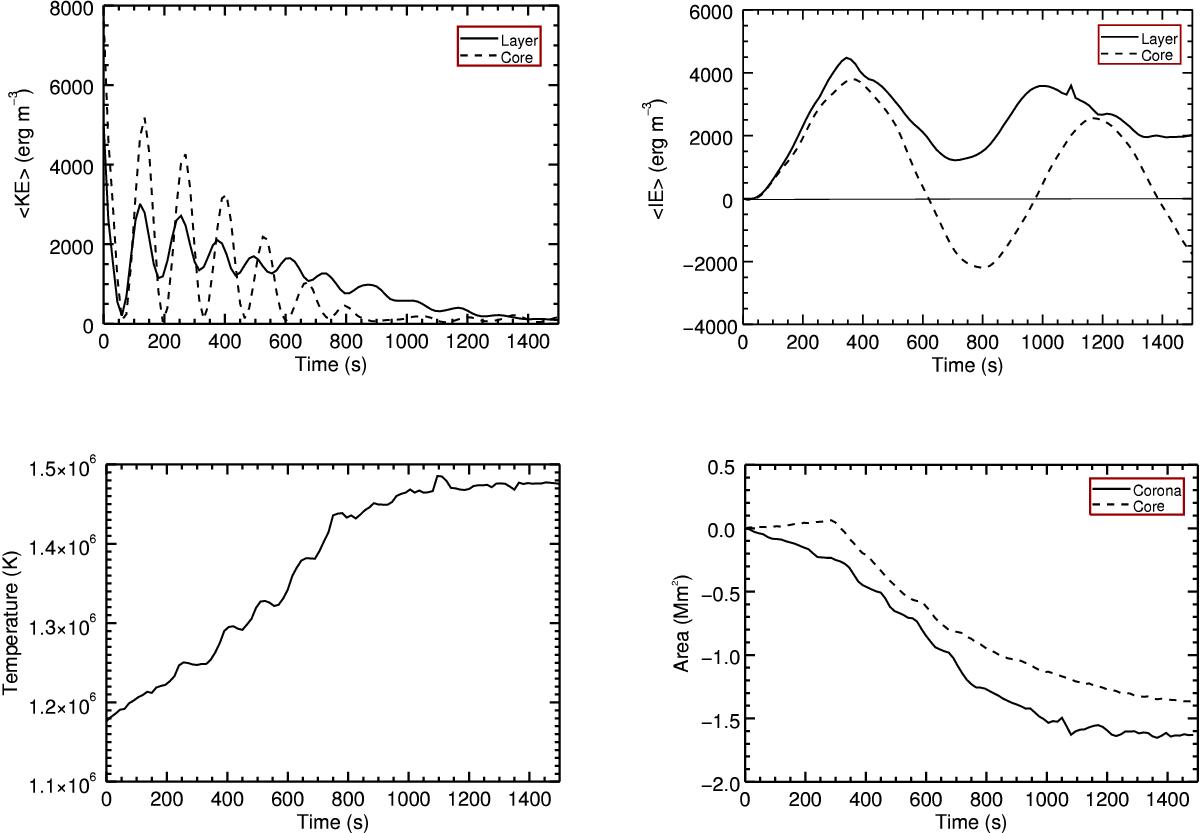
Time evolution of different quantities in the anti-node cross-section of the loop (z = 0) with A = 0.035 and l = 0.33R. Top-left: average kinetic energy (KE) density in the core and layer region of the loop. Top-right: average internal energy density in the core and layer regions of the loop. Bottom-left: average temperature of the loop (average over both the core and layer). Bottom-right: change in the area relative to the initial value, for the core region of the loop and the numerical domain outside the loop (outside both core and layer).
Current usage metrics show cumulative count of Article Views (full-text article views including HTML views, PDF and ePub downloads, according to the available data) and Abstracts Views on Vision4Press platform.
Data correspond to usage on the plateform after 2015. The current usage metrics is available 48-96 hours after online publication and is updated daily on week days.
Initial download of the metrics may take a while.