Fig. 4
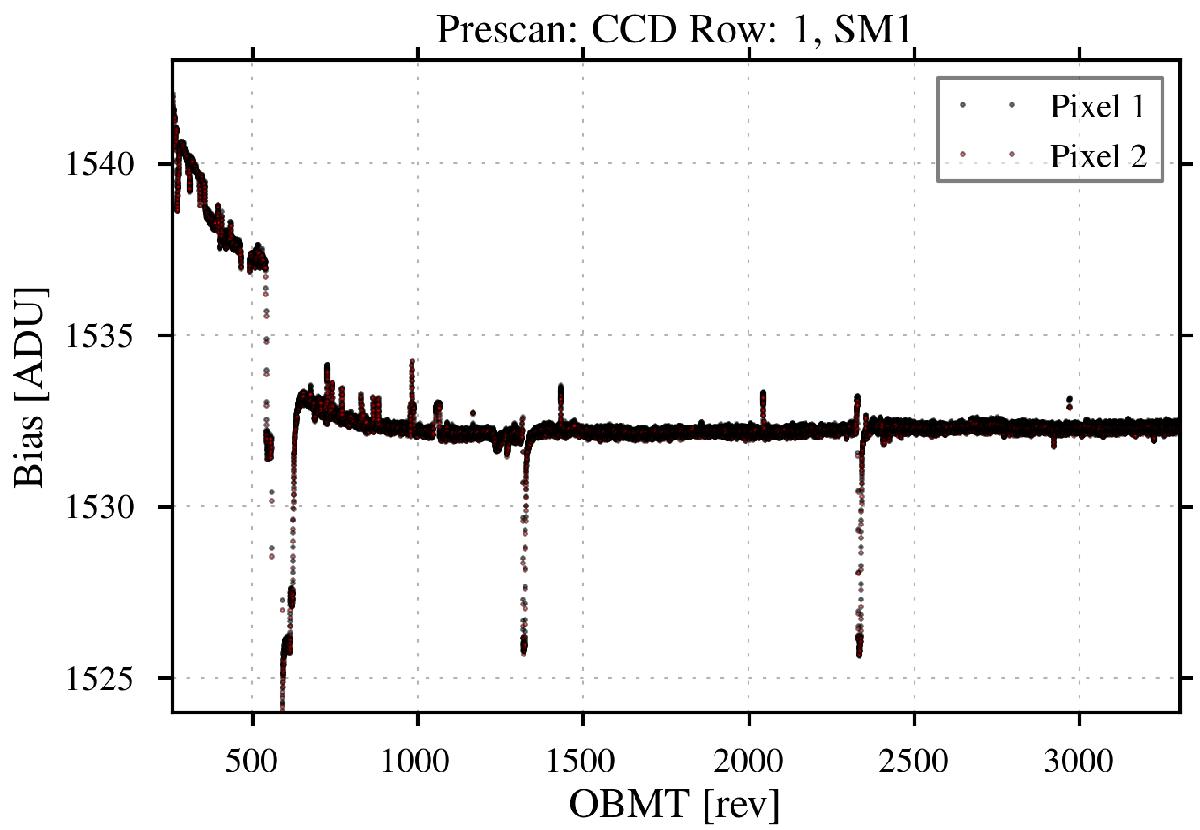
Long-term trend of the first two prescan pixels from the SM1 CCD in row 1. It is important to note the correlation of variability with payload heating events (see Fig. 3) and the relatively stable behaviour during periods of thermal stability. There are also some short-term increases in the bias levels which are not correlated with temperature changes. The origin of these spikes is currently being investigated.
Current usage metrics show cumulative count of Article Views (full-text article views including HTML views, PDF and ePub downloads, according to the available data) and Abstracts Views on Vision4Press platform.
Data correspond to usage on the plateform after 2015. The current usage metrics is available 48-96 hours after online publication and is updated daily on week days.
Initial download of the metrics may take a while.