Free Access
Fig. 18
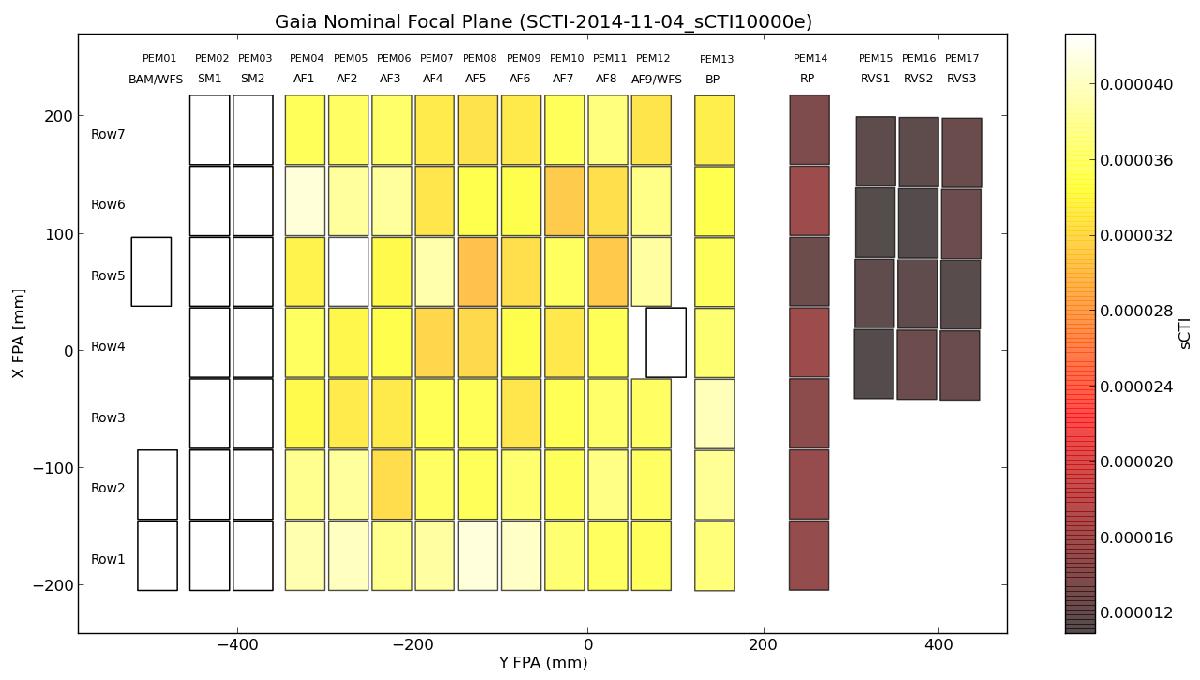
Close to the initial distribution of serial CTI values (at 10 000 electrons) as measured during the first official run of the calibration activity on board. We note the much lower inherent serial CTI for the red devices.
Current usage metrics show cumulative count of Article Views (full-text article views including HTML views, PDF and ePub downloads, according to the available data) and Abstracts Views on Vision4Press platform.
Data correspond to usage on the plateform after 2015. The current usage metrics is available 48-96 hours after online publication and is updated daily on week days.
Initial download of the metrics may take a while.