Free Access
Fig. 3
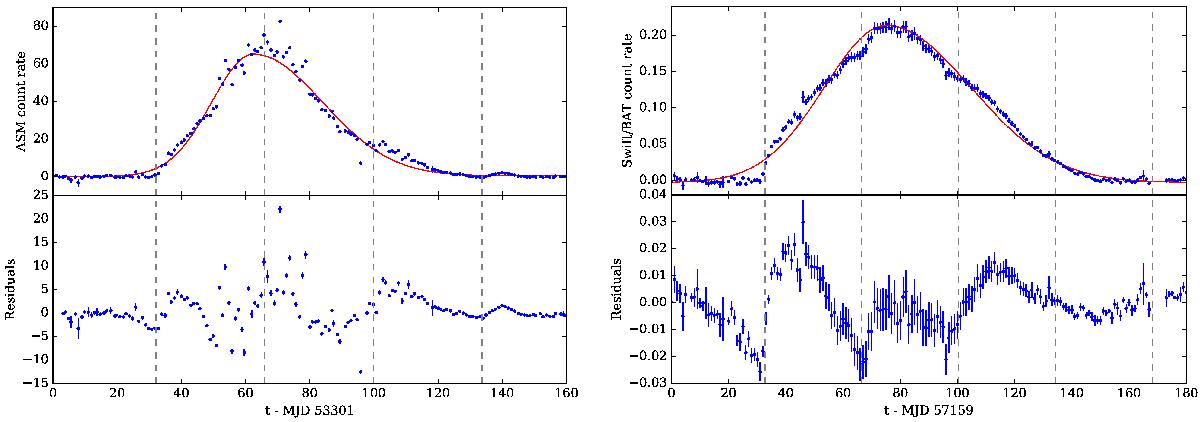
Top panels: outburst profiles (blue points) of V0332+53 observed by RXTE/ASM in 2004–2005 (left panel) and by Swift/BAT in 2015 (right panel) fitted with the asymmetric Gaussian function described in the text (red lines). Bottom panels: detrended data showing the ~34 d orbital modulation.
This figure is made of several images, please see below:
Current usage metrics show cumulative count of Article Views (full-text article views including HTML views, PDF and ePub downloads, according to the available data) and Abstracts Views on Vision4Press platform.
Data correspond to usage on the plateform after 2015. The current usage metrics is available 48-96 hours after online publication and is updated daily on week days.
Initial download of the metrics may take a while.