Fig. 2
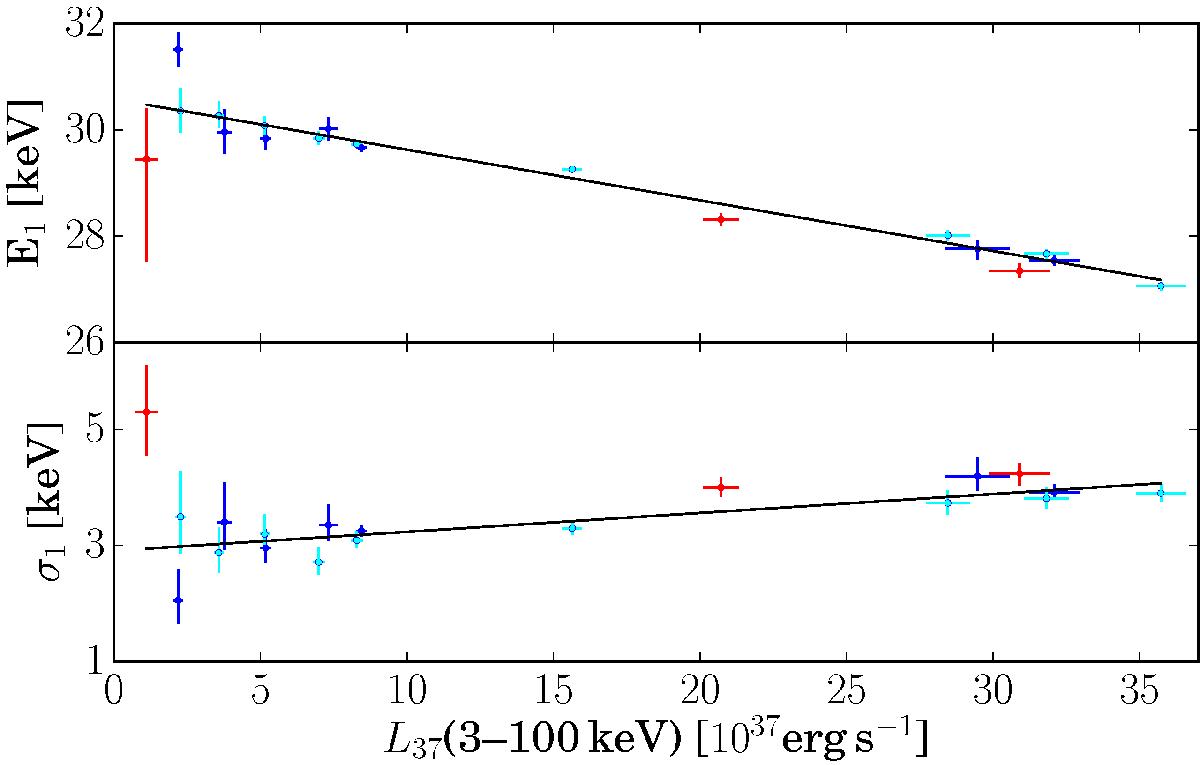
Centroid energy E1 (top panel) and width σ1 (bottom panel) of the fundamental CRSF as a function of the 3–100 keV X-ray luminosity. Red points correspond to the 2015 outburst, blue points to the 2004–2005 outburst based on SPI data, and cyan points to the 2004–2005 outburst based on IBIS data. Black lines show the linear fit. The error bars represent the 68% confidence intervals.
Current usage metrics show cumulative count of Article Views (full-text article views including HTML views, PDF and ePub downloads, according to the available data) and Abstracts Views on Vision4Press platform.
Data correspond to usage on the plateform after 2015. The current usage metrics is available 48-96 hours after online publication and is updated daily on week days.
Initial download of the metrics may take a while.