Free Access
Fig. 2
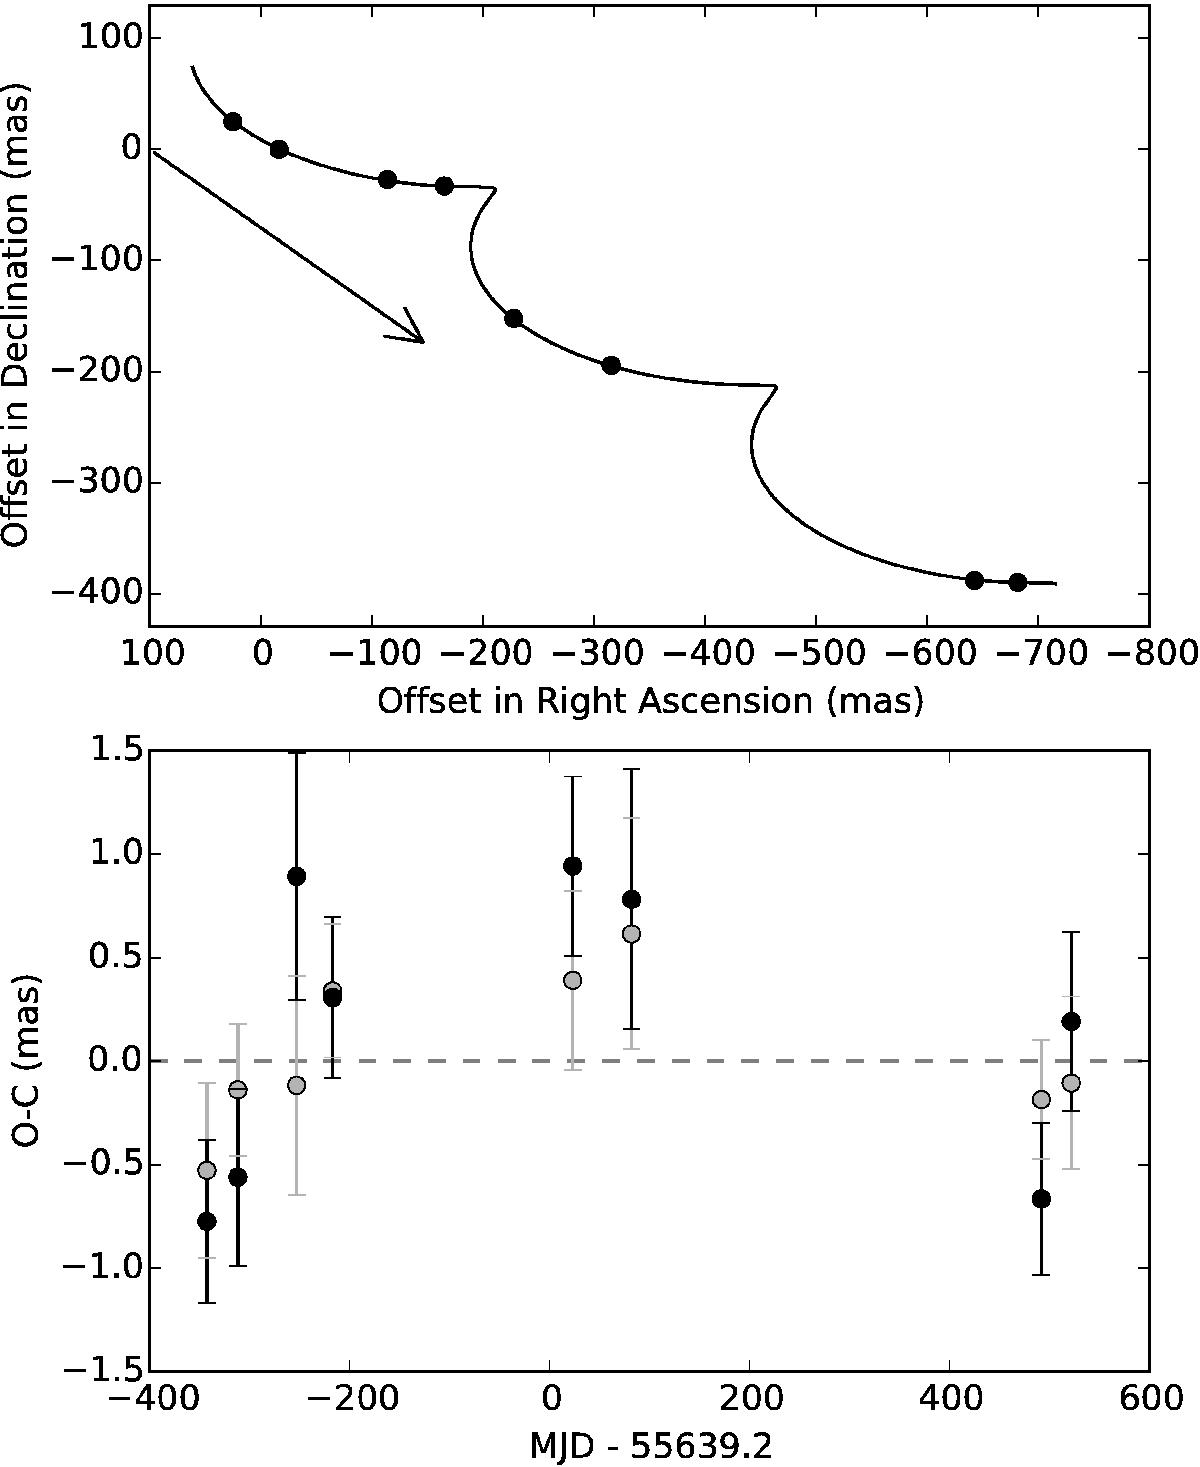
Top: the sky-projected motion of GJ 676A measured with FORS2. Epoch measurements are shown with black circles and the best-fit model is shown by the curve. The arrow indicates the proper motion per year. Bottom: epoch residuals in RA (grey symbols) and Dec (black symbols) of the seven-parameter fit as a function of time.
Current usage metrics show cumulative count of Article Views (full-text article views including HTML views, PDF and ePub downloads, according to the available data) and Abstracts Views on Vision4Press platform.
Data correspond to usage on the plateform after 2015. The current usage metrics is available 48-96 hours after online publication and is updated daily on week days.
Initial download of the metrics may take a while.