Fig. A.1
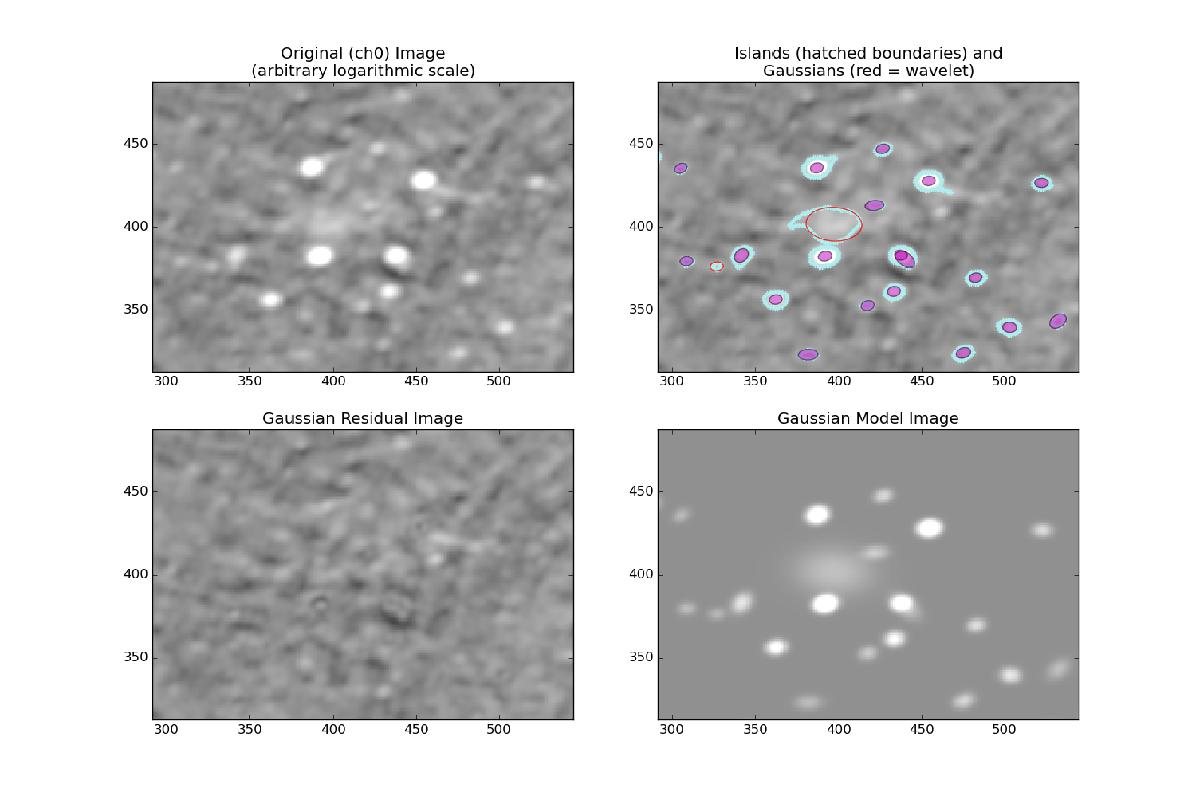
Output of the PyBDSM source finder tool. The axis units are in pixels. From left to right and from top to bottom: original image on which PyBDSM is run (in this example, the ID2 map of Table 3); islands of significant emission (cyan contours) and fitted Gaussians that model identified sources overlaid on the ID2 map; residual after the subtraction of the fitted sources; model of the reconstructed sky. The big red ellipse corresponds to the diffuse emission in the centre of the cluster.
Current usage metrics show cumulative count of Article Views (full-text article views including HTML views, PDF and ePub downloads, according to the available data) and Abstracts Views on Vision4Press platform.
Data correspond to usage on the plateform after 2015. The current usage metrics is available 48-96 hours after online publication and is updated daily on week days.
Initial download of the metrics may take a while.