Fig. 6
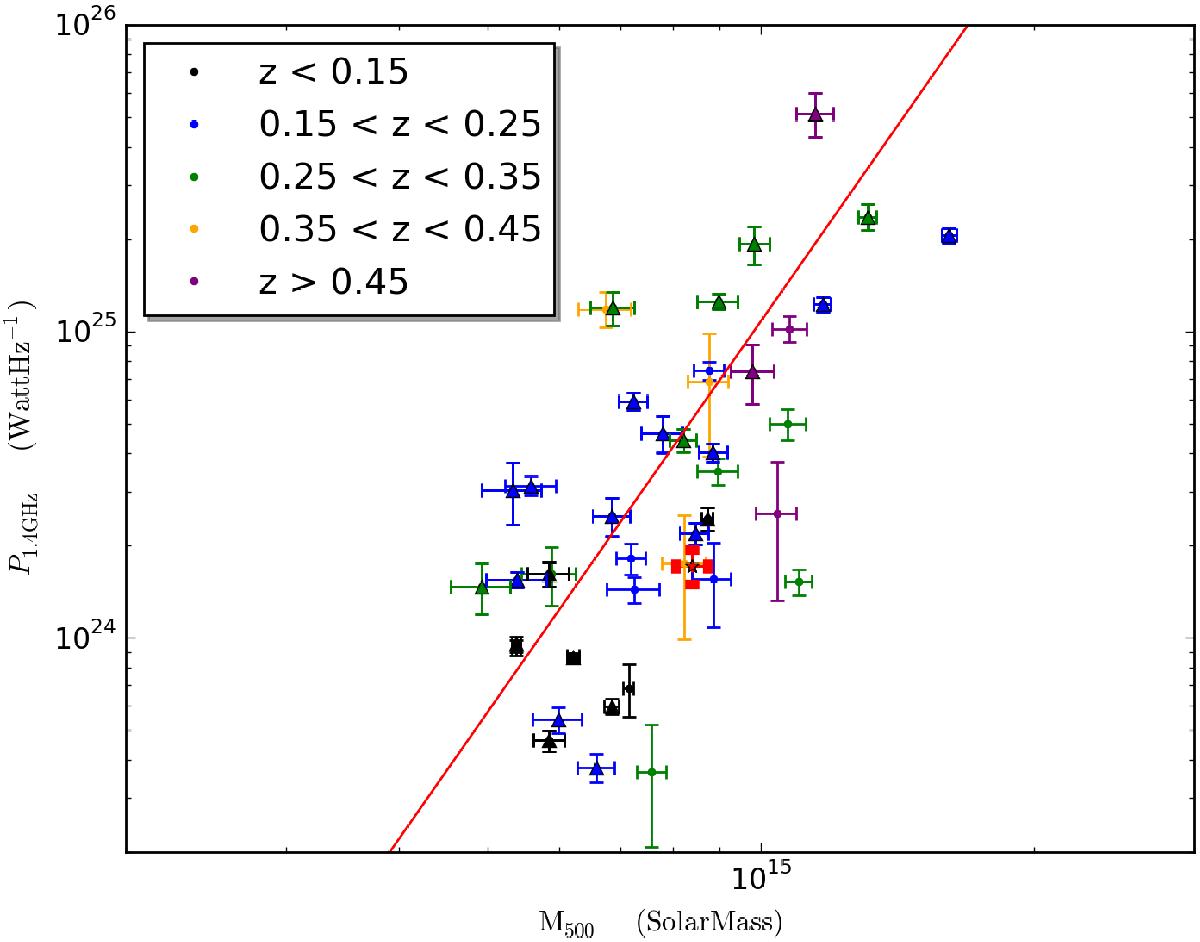
Synchrotron power of RHs at 1.4 GHz (P1.4 GHz) vs. cluster mass (M500 from Planck Collaboration XXVI 2016). Symbols are colour−coded depending on the redshift of RH hosting clusters. The red line is the fit derived in the present paper, including only the RHs with radio fluxes measured at 1.4 GHz (indicated by triangles; see also Table B.1). Analogously to Cassano et al. (2013), we exclude for the fitting ultra-steep spectrum RHs and halos detected in frequencies different from 1.4 GHz, both shown in dots (see Table B.1). The red star corresponds to PLCK G285.0-23.7 detected in this work. When the spectral index is unknown (including PLCK G285.0-23.7 ) we assume the value of α = 1.3.
Current usage metrics show cumulative count of Article Views (full-text article views including HTML views, PDF and ePub downloads, according to the available data) and Abstracts Views on Vision4Press platform.
Data correspond to usage on the plateform after 2015. The current usage metrics is available 48-96 hours after online publication and is updated daily on week days.
Initial download of the metrics may take a while.