Fig. 5
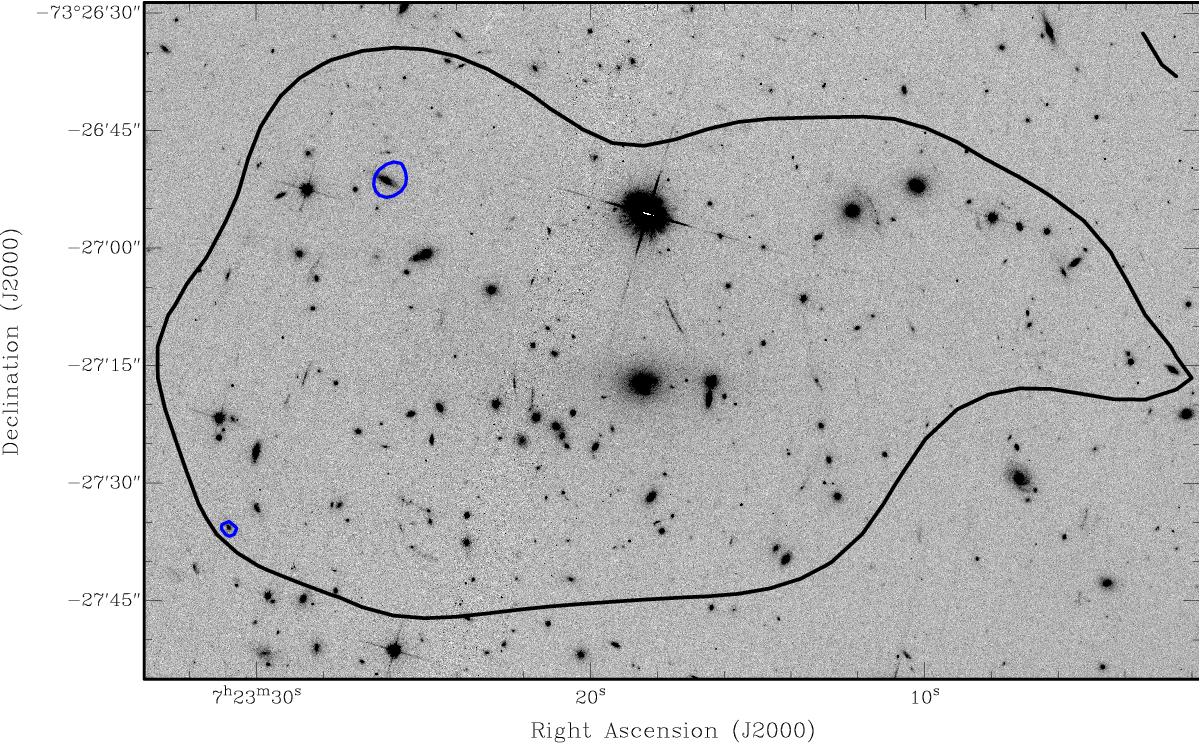
Zoom in the HST-ACS image of PLCK G285.0-23.7 central field (available in the HST archive). For reference, the 3σ contour of the ATCA tapered image centred at 1.867 GHz is shown in black. The blue contours indicate sources of significant radio emission in the full-resolution deep ATCA image of the cluster (i.e. 5 × rms of the final wide-band ATCA map shown in Fig. 2).
Current usage metrics show cumulative count of Article Views (full-text article views including HTML views, PDF and ePub downloads, according to the available data) and Abstracts Views on Vision4Press platform.
Data correspond to usage on the plateform after 2015. The current usage metrics is available 48-96 hours after online publication and is updated daily on week days.
Initial download of the metrics may take a while.