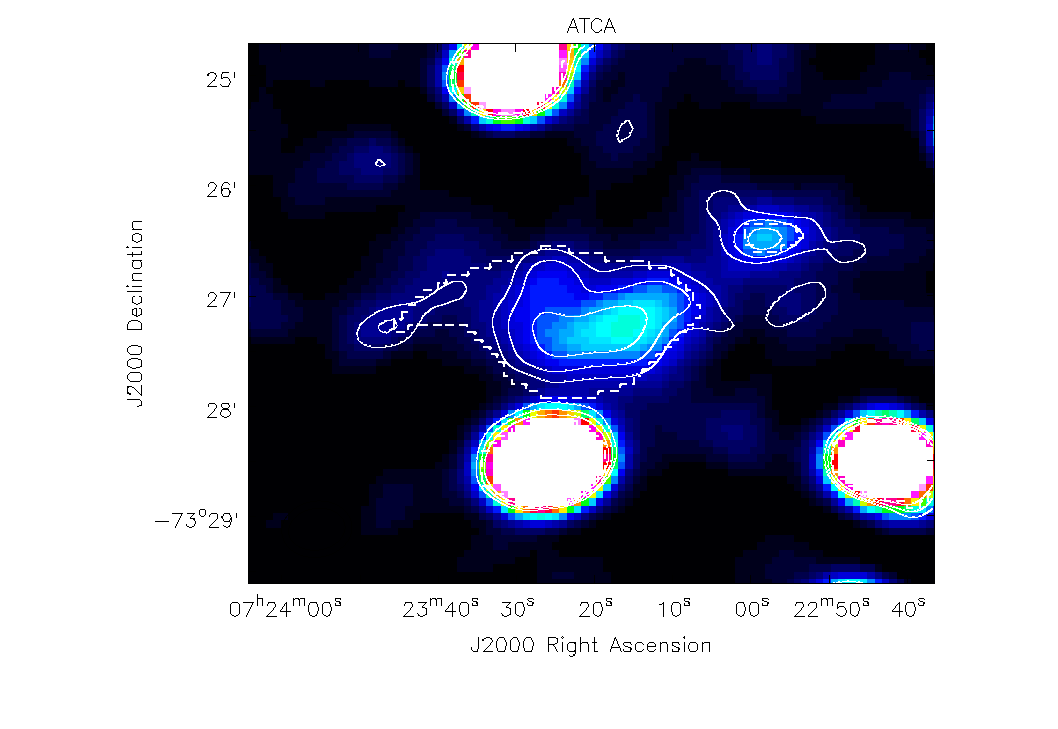
Fig. 3
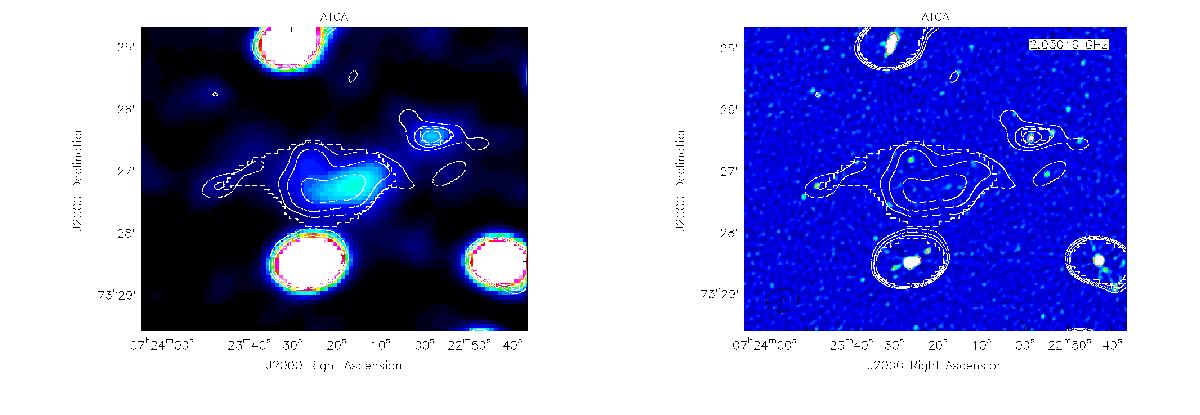
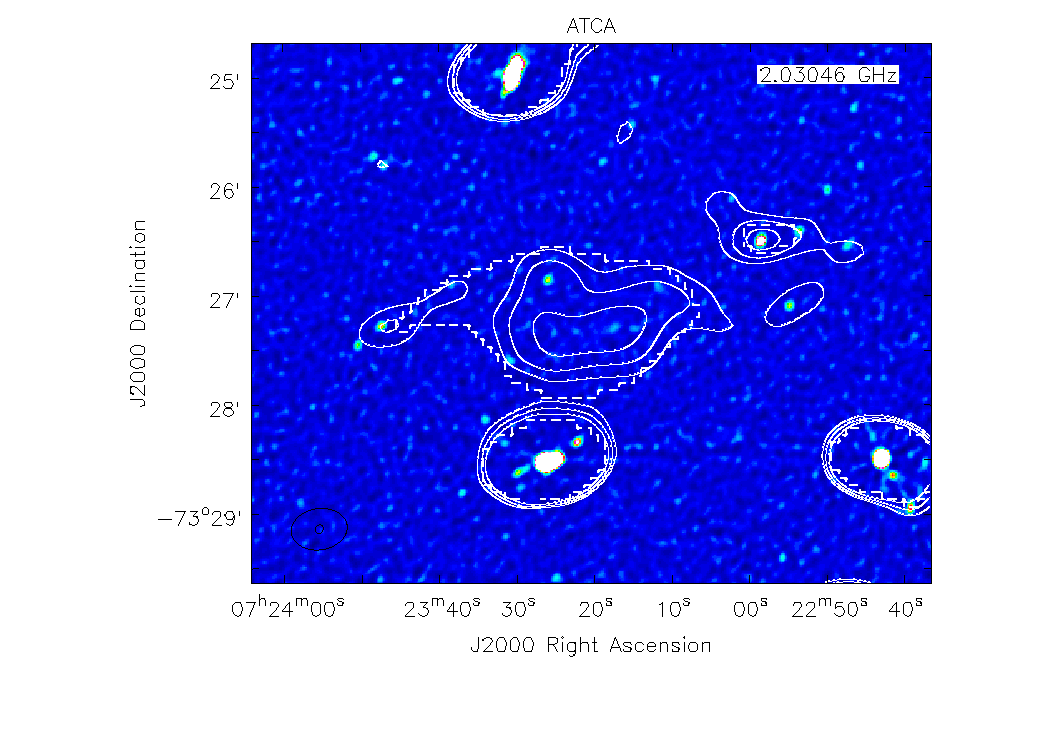
Contours of the ATCA tapered image centred at 1.867 GHz are overlaid on the ATCA wide-band tapered (left) and full-resolution maps (right). Dashed contours correspond to the islands of significant emission detected by PyBDSM on the Block 3 tapered map (cyan contours in Fig. A.1). The continuous curves trace instead “classical” 3, 3 ![]() , 6σ contours (i.e. with the 51.1 μJy/beam rms value of the map estimated by hand on the Block 3 tapered map at ~30 arcsec resolution; see Table 2).
, 6σ contours (i.e. with the 51.1 μJy/beam rms value of the map estimated by hand on the Block 3 tapered map at ~30 arcsec resolution; see Table 2).
Current usage metrics show cumulative count of Article Views (full-text article views including HTML views, PDF and ePub downloads, according to the available data) and Abstracts Views on Vision4Press platform.
Data correspond to usage on the plateform after 2015. The current usage metrics is available 48-96 hours after online publication and is updated daily on week days.
Initial download of the metrics may take a while.