Fig. 7
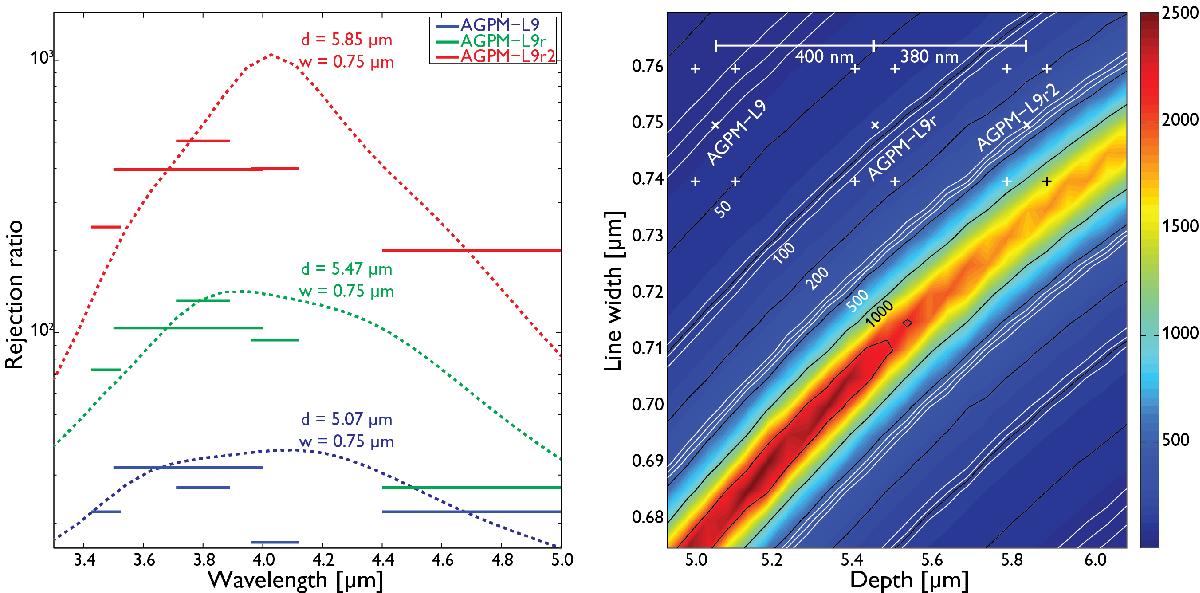
Comparison of rejection ratio between L-band and M-band optical measurements and the RCWA model. Left: measured rejection ratio in five different filters for AGPM-L9 and its remastered versions. AGPM-L9r and AGPM-L9r2 were etched 400 nm and 780 nm deeper than the original AGPM-L9, respectively. Right: possible parameter solutions (marked with crosses) for each optimization, overlaid on predicted coronagraphic performance from RCWA simulations (white lines) with ![]() and wavelength region between 3.5−4.0 μm.
and wavelength region between 3.5−4.0 μm.
Current usage metrics show cumulative count of Article Views (full-text article views including HTML views, PDF and ePub downloads, according to the available data) and Abstracts Views on Vision4Press platform.
Data correspond to usage on the plateform after 2015. The current usage metrics is available 48-96 hours after online publication and is updated daily on week days.
Initial download of the metrics may take a while.