Fig. 4
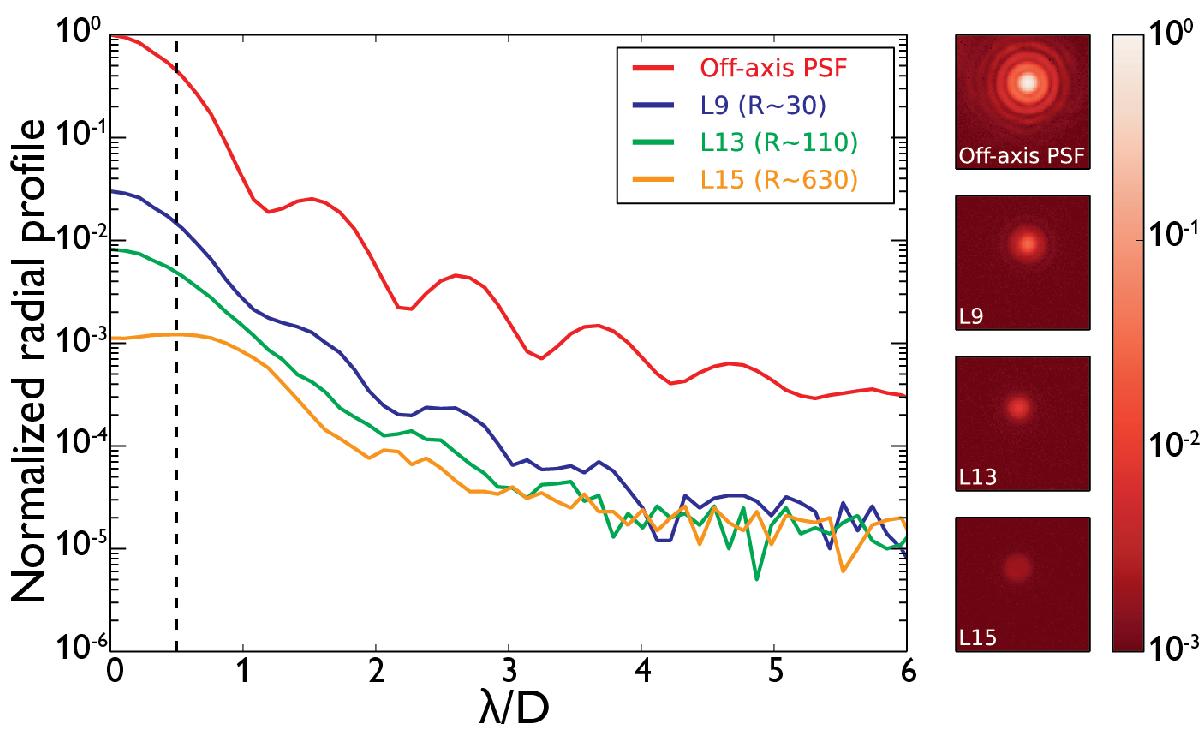
Typical experimental results of AGPM optical performance characterization. Left: radial profile of the image with an AGPM translated by 1 mm (off-axis PSF), and with three different centered AGPMs, showing low (AGPM-L9), median (AGPM-L13) or high (AGPM-L15) performance after initial etching. The vertical dashed line shows the limit of the disk on which the flux is integrated to compute the rejection ratio R. Right: corresponding images shown with a logarithmic scale.
Current usage metrics show cumulative count of Article Views (full-text article views including HTML views, PDF and ePub downloads, according to the available data) and Abstracts Views on Vision4Press platform.
Data correspond to usage on the plateform after 2015. The current usage metrics is available 48-96 hours after online publication and is updated daily on week days.
Initial download of the metrics may take a while.